To quantify river juice, the following characteristics are used.
Drain volume W m 3 or km 3 – the amount of water flowing in the river bed through a given outlet point over a period of time T days, W = 86400 QT [m 3 ] = 8.64 * 10 -5 QT [km 3 ], where Q is the average flow in m 3 /s for time T days; 86,400 is the number of seconds in a day.
Drain module M l/(s*km 2) – the amount of water flowing from a unit area per unit time, M = 103 Q/F, where F is the catchment area in km 2.
Drain layer Y– layer of water in millimeters, evenly distributed over area F and flowing from the catchment area over a certain period of time T days, Y = 86.4TQ / F. Runoff layer per year in millimeters: Y = 31.54M.
Drain coefficient η – the ratio of the amount of the runoff layer from a given area over a certain period of time to the amount of the layer of atmospheric precipitation falling on this area over the same period of time, i.e. η = Y / X, 0 ≤ η ≤ 1. The runoff coefficient is a dimensionless quantity.
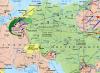
A characteristic feature in the distribution of average long-term runoff on the territory of the USSR is its latitudinal zonality, most clearly expressed in the lowland parts of the country, and a tendency to reduce runoff in the direction from west to east under the influence of continental climate. In the flat parts of our country, the flow rate decreases from north to south. At the same time, within the Russian Plain there is a wide strip of increased flow (> 300 mm), covering the basins of the rivers Vyga, Kem, Onega, Northern Dvina, Pechora, etc. To the south and north of this strip, the flow decreases. The flow rate reaches its lowest values in the Black Sea and especially in the Caspian lowland, 20 – 10 mm or less. On the territory of the West Siberian Plain, the maximum flow is observed at latitude 64–66° and amounts to 250 mm (Pur River basin). On the coast of the Kara Sea, the flow is less, about 200 mm; to the south it decreases and in the steppe zone it is about 10 mm. Relief also affects the distribution of runoff. Minor disturbances in the flat relief of the Russian Plain cause an increase in runoff (regions of the Valdai, Volga, and Central Russian Uplands). Ural ridge - the highest runoff values are on the western slopes compared to the eastern ones. in the river basin Shugor is the maximum flow rate for Europe. parts of the USSR - about 800 mm. Precipitation also affects runoff (the > precipitation falls, the > runoff). On the southern slopes of the Main Caucasus Range the flow is greater than on the northern ones. Wed. drain module for the USSR = 6.2 l/(s*km 2), which is resp. the runoff layer is approximately 195 mm.
Factors influencing river flow
Climate, soil, geological structure of the river basin, vegetation, relief, lake content, economics. activity.
Analysis of the water equation. balance Y = X – Z over a long period allows us to judge that climate Means. affects runoff. For example: evaporation (the > t, the more intense the use), water content in the soil (the > precipitation, the > water). To calculate the average annual evaporation value, the methods of M. I. Budyko and A. R. Konstantinov are used. The Budyko method is based on the level of connection between the heat and water balance of the territory. In general, this equation is: Z/X = f(R/LX), where L is the latent heat of evaporation, Z/X is the coefficient. evaporation, R – rad. balance.
Influence soil on the runoff and its underground and surface components is carried out through the processes of infiltration and evaporation.
Geological structure river basin determines the conditions for the accumulation and consumption of groundwater feeding the rivers. The flow of karst rocks that make up river basins is of great importance. Intensity This influence also depends on the age of the karst. In karst areas, there is usually no surface runoff; precipitation is absorbed by sinkholes, fields, seeps through cracks and replenishes groundwater reserves.
The influence of vegetation is small. It consists in increasing the roughness of the earth. surface, as a result of which the flow of water over the surface of the earth slows down and the possibility of moisture infiltration into the soil increases. The influence of the forest on individual elements of the water balance is great (seepage, evaporation, and partly precipitation).
Slopes influence on river flow is relatively small, due to the fact that the role of soil infiltration capacity overrides the increase or decrease in the rate of water flow over the earth’s surface, which depends on this factor. Bol. relief has an impact on individual water elements. balance: precipitation, moisture infiltration into soils and evaporation. This influence manifests itself depending on the size of the relief forms.
With change lakeness the ratios between areas covered by water and occupied by land change.
Hydrograph - a graph of changes in time of water flow in a river or other watercourse for a year, several years or part of a year (season, high water or flood).
The hydrograph is constructed based on data on daily water flows at the location where river flow is observed. The amount of water consumption is plotted on the ordinate axis, and time intervals are plotted on the abscissa axis.
The hydrograph reflects the nature of the distribution of water flow during the year, season, flood (flood), and low water. The hydrograph is used to calculate the diagram of channel-forming water flows.
Unit hydrograph - a hydrograph showing changes in water flow during a single flood.
Typical hydrograph - a hydrograph reflecting the general features of the intra-annual distribution of water flow in a river.
Long-term flood hydrograph- calculated flood wave in a certain section of a watercourse, characterized by a certain long-term flow rate, a typical hydrograph and the corresponding volume.
The purpose of the hydrograph is to determine the flow by season and the type of feeding of the river.
Quantitative assessment of the share of different types of nutrition in runoff formation is usually carried out using a graphical breakdown of the hydrograph by type of nutrition. In this case, the share of one or another type of nutrition (for example, snow, rain, underground) is determined in proportion to the corresponding areas on the hydrograph.
The greatest difficulties arise when isolating underground recharge during periods of high water or major floods. Depending on the nature of the interaction between surface and groundwater, B.V. Polyakov, B.I. Kudelin, K.V. Voskresensky, M.I. Lvovich, O.V. Popov and other researchers proposed a number of hydrograph division schemes. The most general patterns are as follows. In the absence of a hydraulic connection between river and groundwater, which is usually characteristic of mountain rivers, underground recharge during the period of high water or flood generally repeats the course of the hydrograph, but in a smoother form and with some delay in the maximum underground recharge compared to the maximum water flow. In the presence of a permanent or temporary hydraulic connection between river and groundwater during the rise of the flood, as a result of the groundwater being backed up by the river, underground recharge decreases and reaches a minimum at the highest water level in the river. When high levels remain for a long time, which is more typical of large rivers, river waters are filtered into the ground (“negative underground recharge”), and at the end of the flood or at the beginning of low water, these waters return to the river (coastal regulation of river flow).
Large and medium-sized rivers are constantly monitored at different points, since rivers are very changeable. The level and flow of water in them depend on: the amount of rain and melting. To protect against floods, it is necessary to study behavior. A huge network of stations has been created around the world for this purpose, which continuously monitor changes in water level, its flow, quality, temperature, and ice phenomena. There are now 60 thousand such stations. In addition, 150 thousand precipitation meters and 10 thousand stations for measuring evaporation have been installed on watersheds. Information from all stations enters processing centers, where, with the help of computers, data characterizing the behavior of the river is obtained and published in special “Hydrological yearbooks”, and on this basis a “hydrological cadastre” is created, i.e. a complete summary of data on rivers for the entire observation period.
The existing huge network of hydrological stations covers less than 1% of all rivers in the world with a length of 10 km. Based on the information they collect, hydrologists have developed reliable methods to determine the behavior of unstudied rivers. This made it possible to determine all the rivers of the world, which amounts to almost 42 thousand km3 per year. If we add to this the annual runoff of ice from ice sheets (3 thousand km3) and underground runoff (2.2 thousand km3) into the ocean, then a total of 46 thousand km3 of water flows from land into the ocean annually. But 1 thousand km3 of river flow does not reach, since it goes into lakes and is lost in the sands, in the so-called drainless areas that exist on all continents, an example of which is the sea basin, which includes.
Together with water, rivers carry dissolved substances into the ocean, which contain on average about 90 mg per liter. During the year, rivers carry out 3570 million tons of dissolved substances. River water also contains solid particles - sediment. They can mix while suspended in the water (suspended sediment) and roll and “jump” along the bottom (bottom, or dragged, sediment). Their total mass is 17 billion tons per year. Dissolved substances and sediments are the result of water activity, which erodes and, causing land levels to drop. This process is called. In 1000 years, water dissolves and washes away a layer about 5 cm thick. Consequently, with an average height of modern land above sea level of 700 m, it would take only 14 million years to wash it into the ocean. But this does not happen, because the land is constantly growing. The river redeposits sediment in channels, estuaries, lakes and seas in the form of bottom sediments of various shapes. Thus, rivers turn out to be destroyers and sculptors, processing the surface of the land, the relief of which is formed with the obligatory participation of water.
Drawing up a reliable forecast of the maximum flood possible during the estimated period of operation of the bridge crossing is carried out on the basis of long-term observations of water levels on the rivers. Such observations are made at permanent water-measuring posts (Fig. 3.1). Data on the obtained river water regimes have been published in Hydrological yearbooks since 1936.
In accordance with modern views, a reliable forecast is possible based on materials from stationary observations of the water regime of the river for a period of at least 20 years [ MANUAL TO SNiP 2.05.03-84]. This period is due to the fact that observations should include both low-water years and high-water years. Only in this case can the actual variability of flood heights characteristic of a given watercourse be established.
Typically, permanent water metering posts are combined with hydrometeorological stations. If there are hydraulic structures on the river, then the location for the water post is chosen outside the zone of their influence.
At the water post site, a geodetic alignment is laid out. The location for the target must meet the following requirements:
If possible, the channel should be straight, without sudden changes in depth, without islands or shoals;
If possible, bank slopes should have slopes of 1:5 – 1:2;
the site should be located outside of creeks and reverse currents;
The floodplain should, if possible, have the smallest width, without channels and lakes, with the least amount of vegetation;
the channel and floodplains in the target area should not be subject to erosion;
Bank slopes should not be subject to impacts from ice floes and logs.
On the ground, the alignment is traced with a theodolite and secured with permanent milestones, two on each bank. Along the course of the alignment, geodetic marks are fixed on the ground. The distance between them may be different, but the excess of one mark over another should not be more than 0.5 m. The highest mark should be located 0.5 m above the highest flood level, the lowest 0.5 m below the lowest low-water level. Since the marks are located in the area affected by floods, their marks are constantly monitored. The mark on geodetic marks is transferred from a special benchmark located outside the flood zone. Water levels are measured with an accuracy of 1 cm by installing a geodetic rod on the appropriate mark. Number of measurements from 2 to 24 measurements per day. The conventional horizontal comparison plane, taken as the reference zero when measuring water levels, is called the zero of the water metering station graph. The corresponding mark is the zero mark of the water metering station graph.
Geodetic marks are secured to permanent water posts using piles that are driven or screwed below the freezing depth. Piles should not rise above the ground surface more than 25 cm.
Based on the results of observations at water-measuring posts, water-measuring graphs are constructed (Fig. 3.2), which are published in Hydrological yearbooks.

Flows during spring floods or floods passing through the water post site are calculated using the well-known formula:
 ,
,
Where V– speed of water flow;
– cross-sectional area of the flow at the highest water level.
In this case, both the total flow rate over the entire target area and the flow rates in individual sections of the target are determined. Division into areas can occur depending on the conditions of water flow, for example areas with different roughness coefficients; areas with large differences in depth, etc. (Fig. 3.3). For approximate calculations, in any case, it is necessary to divide into at least three sections: the left floodplain, the channel and the right floodplain.
Fig.3.3. An example of dividing a site into sections to calculate flow rates
The speed of water flow in a particular section of the alignment can be calculated using the formula,
Where H– average water depth in the area;
i– longitudinal slope of the free water surface at RUVV;
a– angle between the direction of flow and the perpendicular
to the axis of the morphological solution;
m– roughness coefficient;
b* – parameter of the live section shape.
The shape parameter of the living section of natural channels is taken depending on the shape coefficient of the channel section
 ,
,
Where H– average depth in the area;
h max– maximum depth in the area.
|
a f | ||||||
|
b * |
· Calculation of the annual runoff rate with incomplete availability of observational data.
The average value of annual flow over a long-term period under constant physical-geographical conditions, including at least two even closed cycles of water content fluctuations, is called the annual flow rate. The annual flow rate is very important when calculating flow and carrying out various types of water management activities on rivers, because it characterizes the potential water resources of a particular region. The great importance of the flow rate as a calculated characteristic is determined by its immutability, because it is determined by the ratio of precipitation and evaporation. Therefore, the flow rate determined from observations over a past period of time can be extended to a future period of time. When calculating the flow rate, there are 3 calculation cases: 1) there is a long period of hydrometric observations; 2) the observation period is insufficient to determine the runoff characteristics; 3) lack of hydrometric observation data.
In case of insufficiency. In this case, the main method of calculation is to use the method of hydrological analogy, i.e. to determine the flow rate of the design river, an analogue river with a long observation period is selected and the flow rate is determined as follows: 1) using reduction formulas, when the flow rate is determined using imperial formulas taking into account some parameters of the design river and the analogue river; 2) the flow rate is determined by the yearly restored annual flow rates of the river, i.e. there is an extension of the river calculation series. 2 methods are used: 1) graphic; 2) analytical. Graphic method. For the joint period of observations of the calculated river and the analogue river, a communication graph is constructed. Using the flow chart of the analogue river, the series of the calculated river is extended. Analytical method. Using the equation of the regression curve, the parameters of the equation are selected and the series of the calculated river is restored using the equation
· Selection of an analogue river
An analogue river is understood as a river that is provided with hydrological observation data and is in similar runoff formation conditions to the river for which the calculation is being performed.
When choosing an analogue river, an assessment and comparison is made:
· spatial structure of fluctuations of the considered hydrological characteristic, reflecting the nature of the spatial connectivity of the considered hydrological characteristic,
· similarity of the flow of analogue rivers and the river under study;
· geographical proximity of watersheds;
· uniformity of conditions for the formation of runoff, similarity of climatic conditions, uniformity of soils (soils) and hydrogeological conditions, degree of lake content, forest cover, swampiness and plowed watersheds;
· average heights of watersheds, slope exposure and hypsometry;
· factors that significantly distort natural river flow (river flow regulation, water discharges, withdrawal of flow for irrigation and other needs).
24.Transverse profile of the river. Flow rate. Methods for its determination.
· Cross profile of the river
In the transverse profile of a river we distinguish two parts: the transverse profile of the river valley and the transverse profile of the river itself. To get an idea of the profile of the river itself, or, more precisely, the river bed, it is necessary to measure the depths of the river.
Measurements are made either manually or mechanically.
For manual measurements, a mark or hand lot is used. The basting is a pole made of flexible and durable wood of round cross-section with a diameter of 4-5 cm and a length of 4 to 7 m.
The lower end of the basting is finished with iron. The basting is painted white and marked in tenths of a meter. The zero division corresponds to the lower end of the basting. Despite the simplicity of the device, basting gives accurate results.
To draw a river profile, a horizontal line is drawn on which the measurement points are plotted to scale. A perpendicular line is drawn down from each estrus, on which the depths obtained from measurements are also plotted to scale. By connecting the lower ends of the verticals, we get a profile. Due to the fact that the depth of rivers is very small compared to the width, when drawing a profile, the vertical scale is taken larger than the horizontal one. Therefore, the profile is distorted, but more visual.
The width of the river is simply determined by the length of the upper horizontal line representing the surface of the river.
The wetted perimeter is the length of the river bottom line on the profile from one edge of the river bank to the other. It is calculated by adding the length of all segments of the bottom line on the drawing of the living cross-section of the river.
The hydraulic radius is the quotient of the living cross-sectional area divided by the length of the wetted perimeter (R=F/Р m).
The average depth is the quotient of the river's open cross-sectional area divided by the river's width (hav =F/Bm).
For lowland rivers, the value of the hydraulic radius is usually very close to the value of the average depth (R≈hcp).
The greatest depth is reconstructed from sounding data.
· Flow rate.
Liquid flow rate is the amount of liquid flowing per unit time through the live cross-section of the flow.
There are volumetric, mass and weight flow rates of liquid.
The volumetric flow rate of a liquid is the volume of liquid flowing per unit time through the live cross-section of the flow. Volumetric fluid flow is usually measured in m3/s, dm3/s or l/s. It is calculated by the formula
where Q is the volumetric flow rate of the liquid,
W is the volume of liquid flowing through the live cross-section of the flow,
t is the time of fluid flow.
The mass flow rate of a liquid is the mass of liquid flowing per unit time through the live cross-section of the flow. Mass flow is usually measured in kg/s, g/s or t/s and is determined by the formula
where QM is the mass flow rate of the liquid,
M is the mass of liquid flowing through the live cross-section of the flow,
t is the time of fluid flow.
· Methods for its determination
Water flow in open streams (Q) is usually found through the open cross-section (W) and the average flow velocity (V) using the formula: Q = W V
Also, water consumption is determined using any substances with known physical or chemical properties. A substance of known concentration, having traveled a certain distance along with the flow, will lower its initial concentration due to mixing. The degree of concentration reduction depends on water flow, therefore, the decrease in the concentration of a substance is a criterion for watercourse flow.