You have probably paid attention to all sorts of banners and entire pages on amateur radio websites containing various indices and indicators of current solar and geomagnetic activity. These are the ones we need to assess the conditions for the passage of radio waves in the near future. Despite the variety of data sources, one of the most popular are banners provided by Paul Herrman (N0NBH), and completely free of charge.
On his website, you can choose any of the 21 available banners to place in a place convenient for you, or use resources on which these banners are already installed. In total, they can display up to 24 parameters depending on the banner form factor. Below is a summary of each of the banner options. The designations of the same parameters may differ on different banners, so in some cases several options are given.
Solar activity parameters
Solar activity indices reflect the level of electromagnetic radiation and the intensity of the flow of particles, the source of which is the Sun.
Solar Flux Intensity (SFI)
SFI is a measure of the intensity of radiation at 2800 MHz generated by the Sun. This value does not directly affect the transmission of radio waves, but its value is much easier to measure, and it correlates well with levels of solar ultraviolet and X-ray radiation.
Sunspot number (SN)
SN is not just the number of sunspots. The value of this value depends on the number and size of spots, as well as on the nature of their location on the surface of the Sun. The range of SN values is from 0 to 250. The higher the SN value, the higher the intensity of ultraviolet and x-ray radiation, which increases the ionization of the Earth’s atmosphere and leads to the formation of layers D, E and F in it. As the level of ionization of the ionosphere increases, the maximum applicable frequency also increases (MUF). Thus, an increase in the SFI and SN values indicates an increase in the degree of ionization in the E and F layers, which in turn has a positive effect on the conditions for the passage of radio waves.
X-Ray Intensity (X-Ray)
The value of this indicator depends on the intensity of X-ray radiation reaching the Earth. The parameter value consists of two parts - a letter reflecting the class of radiation activity, and a number indicating the radiation power in units of W/m2. The degree of ionization of the D layer of the ionosphere depends on the intensity of X-ray radiation. Typically, during the daytime, layer D absorbs radio signals in the low-frequency HF bands (1.8 - 5 MHz) and significantly attenuates signals in the frequency range 7-10 MHz. As the intensity of X-ray radiation increases, the D layer expands and in extreme situations can absorb radio signals in almost the entire HF range, complicating radio communications and sometimes leading to almost complete radio silence, which can last for several hours.
This value reflects the relative intensity of all solar radiation in the ultraviolet range (wavelength 304 angstroms). Ultraviolet radiation has a significant impact on the ionization level of the ionospheric F layer. The 304A value correlates with the SFI value, so its increase leads to improved conditions for the passage of radio waves by reflection from the F layer.
Interplanetary magnetic field (Bz)
The Bz index reflects the strength and direction of the interplanetary magnetic field. A positive value of this parameter means that the direction of the interplanetary magnetic field coincides with the direction of the Earth’s magnetic field, and a negative value indicates a weakening of the Earth’s magnetic field and a decrease in its shielding effects, which in turn increases the impact of charged particles on the Earth’s atmosphere.
Solar Wind/SW
SW is the speed of charged particles (km/h) reaching the Earth's surface. The index value can range from 0 to 2000. A typical value is about 400. The higher the particle speed, the greater the pressure the ionosphere experiences. At SW values exceeding 500 km/h, the solar wind can cause disturbances in the Earth's magnetic field, which will ultimately lead to the destruction of the ionospheric F layer, a decrease in the level of ionosphere ionization and deterioration of transmission conditions in the HF bands.
Proton flux (Ptn Flx/PF)
PF is the density of protons within the Earth's magnetic field. The usual value does not exceed 10. Protons that interact with the Earth's magnetic field move along its lines towards the poles, changing the density of the ionosphere in these zones. At values of proton density above 10,000, the attenuation of radio signals passing through the polar zones of the Earth increases, and at values above 100,000, a complete absence of radio communication is possible.
Electron Flux (Elc Flx/EF)
This parameter reflects the intensity of the electron flow within the Earth's magnetic field. The ionospheric effect from the interaction of electrons with the magnetic field is similar to the proton flux on auroral paths at EF values exceeding 1000.
Noise level (Sig Noise Lvl)
This value in S-meter scale units shows the level of the noise signal that arises as a result of the interaction of the solar wind with the Earth's magnetic field.
Geomagnetic activity parameters
There are two ways in which information about the geomagnetic environment is important for assessing the transmission of radio waves. On the one hand, with increasing disturbance of the Earth's magnetic field, the ionospheric layer F is destroyed, which negatively affects the passage of short waves. On the other hand, conditions arise for auroral passage on VHF.
Indices A and K (A-Ind/K-Ind)
The state of the Earth's magnetic field is characterized by indices A and K. An increase in the value of the K index indicates its increasing instability. K values greater than 4 indicate the presence of a magnetic storm. Index A is used as a base value to determine the dynamics of changes in index K values.
Aurora/Aur Act
The value of this parameter is a derivative of the level of solar energy power, measured in gigawatts, that reaches the polar regions of the Earth. The parameter can take values in the range from 1 to 10. The higher the level of solar energy, the stronger the ionization of the F layer of the ionosphere. The higher the value of this parameter, the lower the latitude of the auroral cap boundary and the higher the probability of auroras occurring. At high values of the parameter, it becomes possible to conduct long-distance radio communications on VHF, but at the same time, polar routes at HF frequencies can be partially or completely blocked.
Latitude (Aur Lat)
The maximum latitude at which an auroral passage is possible.
Maximum usable frequency (MUF)
The value of the maximum applicable frequency measured at the specified meteorological observatory (or observatories, depending on the type of banner), at the given point in time (UTC).
Earth-Moon-Earth Path Attenuation (EME Deg)
This parameter characterizes the amount of attenuation in decibels of the radio signal reflected from the lunar surface on the Earth-Moon-Earth path, and can take the following values: Very Poor (> 5.5 dB), Poor (> 4 dB), Fair (> 2.5 dB), Good (> 1.5 dB), Excellent (
Geomagnetic conditions (Geomag Field)
This parameter characterizes the current geomagnetic situation based on the value of the K index. Its scale is conventionally divided into 9 levels from Inactive to Extreme Storm. With the Major, Severe and Extreme Storm values, passage on the HF bands deteriorates until they are completely closed, and the likelihood of an auroral passage increases.
In the absence of a program, you can make a good estimate forecast yourself. Obviously, high solar flux index values are good. Generally speaking, the more intense the flow, the better the conditions will be on the high frequency HF bands, including the 6 m band. However, the flow values from previous days should also be taken into account. Maintaining large values for several days will ensure a higher degree of ionization of the F2 layer of the ionosphere. Typically, values greater than 150 will guarantee good HF transmission. High levels of geomagnetic activity also have an unfavorable side effect, significantly reducing the MUF. The higher the level of geomagnetic activity according to the Ap and Kp indices, the lower the MUF. The actual MUF values depend not only on the strength of the magnetic storm, but also on its duration.
The geomagnetic field (GF) is generated by sources located in the magnetosphere and ionosphere. It protects the planet and life on it from the harmful influences. Its presence was observed by everyone who held a compass and saw how one end of the arrow points to the south and the other to the north. Thanks to the magnetosphere, great discoveries in physics have been made, and its presence is still used for marine, underwater, aviation and space navigation.
General characteristics
Our planet is a huge magnet. Its north pole is located in the “upper” part of the Earth, not far from the geographic pole, and its south pole is located near the corresponding geographic pole. From these points, magnetic field lines extending for many thousands of kilometers into space, making up the magnetosphere itself.
The magnetic and geographic poles are quite distant from each other. If you draw a clear line between the magnetic poles, you can end up with a magnetic axis with an inclination angle of 11.3° to the axis of rotation. This value is not constant, and all because the magnetic poles move relative to the surface of the planet, changing their location every year.
Nature of the geomagnetic field
The magnetic screen is generated by electric currents (moving charges), which are born in the outer liquid core located inside the Earth at a very decent depth. It is a fluid metal and it moves. This process is called convection. The moving matter of the nucleus forms currents and, as a consequence, magnetic fields.
The magnetic shield reliably protects the Earth from its main source - the solar wind - the movement of ionized particles flowing from the Magnetosphere deflects this continuous flow, redirecting it around the Earth, so that hard radiation does not have a detrimental effect on all living things on the blue planet.

If the Earth did not have a geomagnetic field, the solar wind would strip it of its atmosphere. According to one hypothesis, this is exactly what happened on Mars. The solar wind is far from the only threat, since the Sun also releases large amounts of matter and energy in the form of coronal ejections, accompanied by a strong flow of radioactive particles. However, even in these cases, the Earth's magnetic field protects it by deflecting these currents away from the planet.
The magnetic shield changes its poles approximately every 250,000 years. The north magnetic pole takes the place of the north one, and vice versa. Scientists do not have a clear explanation why this happens.
History of the study
People's acquaintance with the amazing properties of earthly magnetism occurred at the dawn of civilization. Already in ancient times, humanity was aware of magnetic iron ore - magnetite. However, who and when discovered that natural magnets are equally oriented in space in relation to the geographic poles of the planet is unknown. According to one version, the Chinese were familiar with this phenomenon already in 1100, but they began to use it in practice only two centuries later. In Western Europe, the magnetic compass began to be used in navigation in 1187.
Structure and characteristics

The Earth's magnetic field can be divided into:
- the main magnetic field (95%), the sources of which are located in the outer, electrically conductive core of the planet;
- anomalous magnetic field (4%) created by rocks in the upper layer of the Earth with good magnetic susceptibility (one of the most powerful is the Kursk magnetic anomaly);
- external magnetic field (also called alternating, 1%) associated with solar-terrestrial interactions.
Regular geomagnetic variations
Changes in the geomagnetic field over time under the influence of both internal and external (relative to the surface of the planet) sources are called magnetic variations. They are characterized by the deviation of the GP components from the average value at the observation site. Magnetic variations have a continuous rearrangement in time, and such changes are often periodic in nature.

Regular variations that repeat daily are changes in the magnetic field associated with solar- and lunar-diurnal changes in the MS strength. Variations reach a maximum during the day and at lunar opposition.
Irregular geomagnetic variations
These changes arise as a result of the influence of the solar wind on the Earth's magnetosphere, changes within the magnetosphere itself and its interaction with the ionized upper layer of the atmosphere.
- Twenty-seven-day variations exist as a pattern of repeated growth of magnetic disturbance every 27 days, corresponding to the period of rotation of the main celestial body relative to the earthly observer. This trend is due to the existence of long-lived active regions on our home star, observed during several of its revolutions. It manifests itself in the form of a 27-day repeatability of geomagnetic disturbance and
- Eleven-year variations are associated with the periodicity of sunspot activity of the Sun. It was revealed that during the years of the greatest accumulation of dark areas on the solar disk, magnetic activity also reaches its maximum, but the growth of geomagnetic activity lags behind the growth of solar activity on average by a year.
- Seasonal variations have two maxima and two minima, corresponding to the periods of the equinoxes and the time of the solstice.
- Secular, in contrast to the above, are of external origin, are formed as a result of the movement of matter and wave processes in the liquid electrically conductive core of the planet and are the main source of information about the electrical conductivity of the lower mantle and core, about the physical processes leading to convection of matter, as well as about the mechanism generation of the Earth's geomagnetic field. These are the slowest variations - with periods ranging from several years to a year.
The influence of the magnetic field on the living world
Despite the fact that the magnetic screen cannot be seen, the inhabitants of the planet feel it perfectly. For example, migratory birds build their route based on it. Scientists put forward several hypotheses regarding this phenomenon. One of them suggests that birds perceive it visually. In the eyes of migratory birds there are special proteins (cryptochromes) that are able to change their position under the influence of the geomagnetic field. The authors of this hypothesis are confident that cryptochromes can act as a compass. However, not only birds, but also sea turtles use a magnetic shield as a GPS navigator.

Impact of a magnetic shield on a person
The influence of the geomagnetic field on a person is fundamentally different from any other, be it radiation or dangerous current, since it affects the human body completely.
Scientists believe that the geomagnetic field operates in an ultra-low frequency range, as a result of which it responds to basic physiological rhythms: respiratory, cardiac and brain. A person may not feel anything, but the body still reacts to it with functional changes in the nervous, cardiovascular systems and brain activity. Psychiatrists have been monitoring the relationship between surges in the intensity of the geomagnetic field and exacerbation of mental illnesses, often leading to suicide, for many years.
"Indexing" of geomagnetic activity
Magnetic field disturbances associated with changes in the magnetospheric-ionospheric current system are called geomagnetic activity (GA). To determine its level, two indices are used - A and K. The latter shows the value of GA. It is calculated from magnetic shield measurements taken daily at three-hour intervals, starting at 00:00 UTC (Coordinated Universal Time). The highest values of magnetic disturbance are compared with the values of the geomagnetic field on a quiet day for a particular scientific institution, and the maximum values of the observed deviations are taken into account.

Based on the data obtained, the K index is calculated. Due to the fact that it is a quasi-logarithmic value (i.e., it increases by one when the disturbance increases by approximately 2 times), it cannot be averaged in order to obtain a long-term historical picture of the state of the planet’s geomagnetic field. For this purpose there is an index A, which represents the daily average value. It is determined quite simply - each dimension of the K index is converted into an equivalent index. The K values obtained throughout the day are averaged, thanks to which it is possible to obtain the A index, the value of which on ordinary days does not exceed the threshold of 100, and during periods of severe magnetic storms can exceed 200.
Since geomagnetic field disturbances manifest themselves differently in different parts of the planet, the values of the A index from different scientific sources can vary noticeably. In order to avoid such a run-up, the A indices obtained by the observatories are reduced to the average and a global index A p appears. The same is true with the K p index, which is a fractional value in the range 0-9. Its value from 0 to 1 indicates that the geomagnetic field is normal, which means that optimal conditions for transmission in the shortwave ranges remain. Of course, provided there is a fairly intense flux of solar radiation. A geomagnetic field of 2 is characterized as a moderate magnetic disturbance, which slightly complicates the passage of decimeter waves. Values from 5 to 7 indicate the presence of geomagnetic storms that create serious interference with the mentioned range, and in the case of a strong storm (8-9 points) they make the passage of short waves impossible.
The influence of magnetic storms on human health
50-70% of the world's population are exposed to the negative effects of magnetic storms. At the same time, the onset of the stress reaction in some people is noted 1-2 days before the magnetic disturbance, when flares in the sun are observed. For others, at the very peak or some time after excessive geomagnetic activity.

Meth-dependent people, as well as those who suffer from chronic diseases, need to monitor information about the geomagnetic field for a week in order to eliminate physical and emotional stress, as well as any actions and events that could lead to stress, when possible approaching magnetic storms occur.
Magnetic field deficiency syndrome
The weakening of the geomagnetic field in rooms (hypogeomagnetic field) occurs due to the design features of various buildings, wall materials, and magnetized structures. When staying in a room with a weakened GP, blood circulation and the supply of oxygen and nutrients to tissues and organs are disrupted. Weakening of the magnetic shield also affects the nervous, cardiovascular, endocrine, respiratory, skeletal and muscular systems.
The Japanese doctor Nakagawa “called” this phenomenon “human magnetic field deficiency syndrome.” In terms of its importance, this concept may well compete with the deficiency of vitamins and minerals.
The main symptoms indicating the presence of this syndrome are:
- increased fatigue;
- decreased performance;
- insomnia;
- headache and joint pain;
- hypo- and hypertension;
- disruptions in the digestive system;
- disturbances in the functioning of the cardiovascular system.
31.10.2012

Levels of geomagnetic activity are expressed using two indices - A and K, showing the magnitude of magnetic and ionospheric disturbance. The K index is calculated on the basis of magnetic field measurements taken daily at three-hour intervals, starting from zero hours according to universal time (otherwise UTC, world time, Greenwich time).
The maximum values of the magnetic disturbance are compared with the values of the magnetic field on a quiet day for a particular observatory, and the largest value of the noted deviations is taken into account. Then, according to a special table, the resulting value is converted into the K index. The K index is a quasi-logarithmic value, that is, its value increases by one when the magnetic field disturbance approximately doubles, which makes it difficult to calculate the average value.
Since magnetic field disturbances manifest themselves differently at different points on the Earth, such a table exists for each of the 13 geomagnetic observatories located at geomagnetic latitudes from 44 to 60 degrees in both hemispheres of the planet. In general, with a large number of measurements over a long period of time, this makes it possible to calculate the average planetary K p -index, which is a fractional value in the range from 0 to 9.
 |
The A-index is a linear quantity, that is, as geomagnetic disturbance increases, it increases similarly to it, as a result of which the use of this index often makes more physical sense. The values of the A p -index are correlated with the values of the K p -index and represent averaged indicators of magnetic field variation. The index A p is expressed in integers from 0 to > 400. For example, the interval K p from 0 o to 1+ corresponds to the values A p from 0 to 5, and K p from 9- to 9 0 - 300 and > 400, respectively. There is also a special table to determine the value of the A p -index.
In practical applications, the K-index is taken into account to determine the transmission of radio waves. A level from 0 to 1 corresponds to a calm geomagnetic environment and good conditions for the passage of HF. Values from 2 to 4 indicate moderate geomagnetic disturbance, which makes the passage of the short-wave range somewhat difficult. Values starting from 5 indicate geomagnetic storms that create serious interference with the specified range, and with strong storms (8 and 9) make the passage of short waves impossible.
One of the key skills of any HF DX hunter is the ability to assess conditions at any given time. Excellent transmission conditions, when many stations from all over the world are heard on the bands, can change so that the bands become empty and only a few stations make their way through the noise and crackle of the air. In order to understand what and why is happening on the radio, as well as to evaluate its capabilities at a given time, three main indices are used: solar flux, A p and K p . A good practical understanding of what these values are and what their meaning is is an undeniable advantage even for a radio amateur with the best and most modern set of communications equipment.
Earth's atmosphere
The ionosphere can be thought of as something multi-layered. The boundaries of the layers are quite arbitrary and are determined by areas with a sharp change in the ionization level (Fig. 1). The ionosphere has a direct impact on the nature of the propagation of radio waves, because depending on the degree of ionization of its individual layers, radio waves can be refracted, that is, the trajectory of their propagation ceases to be rectilinear. Quite often the degree of ionization is high enough that radio waves are reflected from highly ionized layers and return to Earth (Fig. 2).
The conditions for the passage of radio waves in the HF bands are constantly changing depending on changes in the levels of ionization of the ionosphere. Solar radiation, reaching the upper layers of the earth's atmosphere, ionizes gas molecules, generating positive ions and free electrons. This entire system is in dynamic equilibrium due to the process of recombination, the reverse of ionization; when positively charged ions and free electrons interact with each other, they again form gas molecules. The higher the degree of ionization (the more free electrons), the better the ionosphere reflects radio waves. In addition, the higher the level of ionization, the higher the frequencies at which good transmission conditions can be provided. The level of ionization of the atmosphere depends on many factors, including the time of day, time of year, and the most important factor - the solar activity cycle. It is reliably known that the intensity of solar radiation depends on the number of spots on the Sun. Accordingly, the maximum radiation received from the Sun is achieved during periods of maximum solar activity. In addition, during these periods geomagnetic activity also increases due to the increased intensity of the flow of ionized particles from the Sun. Usually this flow is quite stable, but due to solar flares it can increase significantly. The particles reach near-Earth space and interact with the Earth's magnetic field, causing disturbances and generating magnetic storms. In addition, these particles can cause ionospheric storms, during which short-wave radio communications become difficult and sometimes even impossible.
Solar radiation flux
A quantity known as solar flux is the main indicator of solar activity and determines the amount of radiation the Earth receives from the Sun. It is measured in solar flux units (SFU) and is determined by the level of radio noise emitted at 2800 MHz (10.7 cm). The Penticton Radio Astronomy Observatory in British Columbia, Canada, publishes this value daily. The solar radiation flux has a direct impact on the degree of ionization and, consequently, the electron concentration in the F 2 region of the ionosphere. As a result, it gives a very good idea of the feasibility of long-distance radio communications.

The magnitude of the solar flux can vary within 50 - 300 units. Small values indicate that the maximum usable frequency (MUF) will be low and the overall radio wave conditions will be poor, especially on the high frequency bands. (Fig. 2) On the contrary, large solar flux values indicate sufficient ionization, which allows long-distance communications to be established at higher frequencies. However, it should be remembered that it takes several days in a row with high solar flux values for the passage conditions to significantly improve. Typically, during periods of high solar activity, the solar flux exceeds 200 with short-term bursts up to 300.
Geomagnetic activity
There are two indices that are used to determine the level of geomagnetic activity - A and K. They show the magnitude of magnetic and ionospheric disturbances. The K index shows the magnitude of geomagnetic activity. Every day, every 3 hours, starting from 00:00 UTC, the maximum deviations of the index value relative to the values for a quiet day at the selected observatory are determined, and the largest value is selected. Based on this data, the value of the K index is calculated. The K index is a quasi-logarithmic value, so it cannot be averaged to obtain a long-term historical picture of the state of the Earth's magnetic field. To solve this problem, there is an index A, which represents the daily average. It is calculated quite simply - each measurement of the K index, made, as mentioned above, with a 3-hour interval, according to Table 1
is converted to an equivalent index. The values of this index obtained during the day are averaged and the result is the value of the A index, which on normal days does not exceed 100, and during very serious geomagnetic storms can reach 200 or even more. The values of the A index may differ at different observatories, since disturbances in the Earth's magnetic field can be local in nature. To avoid discrepancies, the A indices obtained at different observatories are averaged and the resulting global index A p is obtained. In the same way, the value of the K p index is obtained - the average value of all K indices obtained at various observatories around the globe. Its values between 0 and 1 characterize a quiet geomagnetic environment, and this may indicate the presence of good transmission conditions in the short-wave ranges, provided that the intensity of the solar radiation flux is sufficiently high. Values between 2 and 4 indicate a moderate or even active geomagnetic environment, which is likely to negatively affect radio wave conditions. Further on the scale of values: 5 indicates a minor storm, 6 indicates a strong storm, and 7 - 9 indicates a very strong storm, as a result of which there will most likely be no passage on the HF. Despite the fact that geomagnetic and ionospheric storms are interrelated, it is worth noting again that they are different. A geomagnetic storm is a disturbance in the Earth's magnetic field, and an ionospheric storm is a disturbance in the ionosphere.
Interpretation of index values
The simplest way to use index values is to enter them as input into a radio wave propagation forecast program. This will allow you to get a more or less reliable forecast. In their calculations, these programs take into account additional factors, such as signal propagation paths, because the influence of magnetic storms will be different for different paths.
In the absence of a program, you can make a good estimate forecast yourself. Obviously, high solar flux index values are good. Generally speaking, the more intense the flow, the better the conditions will be on the high frequency HF bands, including the 6 m band. However, the flow values from previous days should also be taken into account. Maintaining large values for several days will ensure a higher degree of ionization of the F2 layer of the ionosphere. Typically, values greater than 150 will guarantee good HF transmission. High levels of geomagnetic activity also have an unfavorable side effect, significantly reducing the MUF. The higher the level of geomagnetic activity according to the Ap and Kp indices, the lower the MUF. The actual MUF values depend not only on the strength of the magnetic storm, but also on its duration.
Conclusion
Constantly monitor changes in solar and geomagnetic activity indices. This data is available on the sites www.eham.net, www.qrz.com, www.arrl.org and many others, and can also be obtained through the terminal when connecting to DX clusters. Good passage on HF is possible during periods when the solar flux exceeds 150 for several days, and the K p index at the same time remains below 2. When these conditions are met, check the bands - there is probably some good DX working there already!
Based on Understanding Solar Indices By Ian Poole, G3YWX
Good afternoon everyone! Today I decided to write such an unusually interesting article about magnetic storms. In general, before, I had never felt any action on myself and did not even think about this question, what it is and in general how they affect humans and our Earth.
But time has passed, and now I increasingly feel these magnetic flows on myself, so to speak. Sometimes I feel bad, but it turns out that magnetic days are one of the reasons.
Let's figure out what it is. I won’t go into great detail, so in this note, I just want to give you small recommendations and publish a schedule of magnetic storms by day for the month. May I warn you against troubles related to your health.
Magnetic storms: what are they? The influence of magnetic storms on humans
Flares constantly occur on the Sun, some of them more powerful, some weaker. And when particularly strong flares occur, a stream of charged particles rushes in different directions, including towards the Earth. After a day, or maybe two, they reach the Earth and begin to influence the natural magnetic field of our planet.

In the Far North, this can be seen from the state of the atmosphere and a phenomenon called the Northern Lights occurs. So, when a distortion of the geomagnetic field occurs, this is reflected in the human condition.
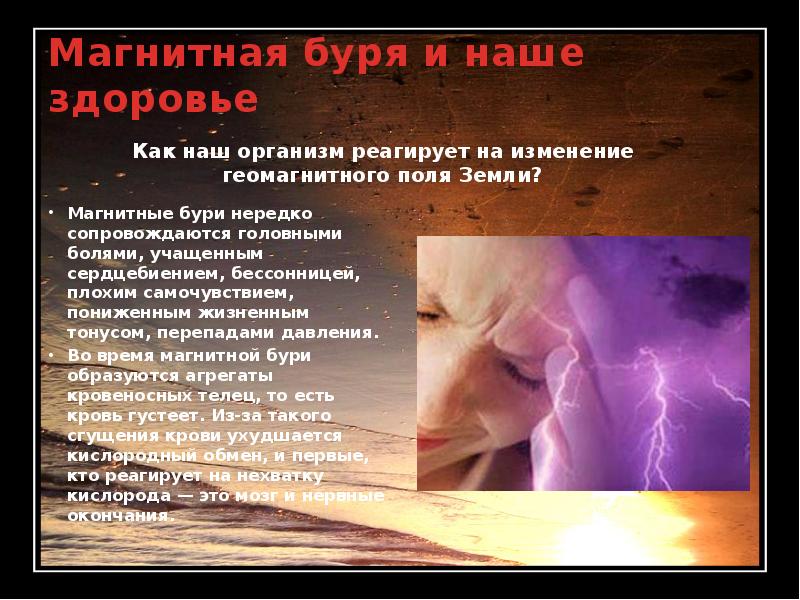
So, under normal conditions, blood moves through the capillaries quite quickly, but when the geomagnetic background changes, the movement of blood slows down through the capillaries, our red blood cells in the blood stick together and move very slowly because of which, the body is forced to increase blood pressure, which occurs increased release of adrenal hormones, stress hormones - this includes cortisol and adrenaline. The level of melatonin in the blood, which is responsible for the body’s adaptation, changes, and increases in 75% of cases of myocardial infarction.
According to ambulance observations, on days when there are magnetic storms, there are 20% more emergencies than usual.
How to protect yourself and how to help yourself survive a magnetic storm?
While preparing for this post, I found very interesting material from the “Live Healthy” program. I would really like you to watch this video. In it, Elena Malysheva and her assistants show and explain everything very clearly and clearly, using experiments, and at the end they give valuable recommendations.
Therefore, if you want to help yourself, then do not deny yourself this important advice, which is given at the very end:
- on such days, reduce physical activity and any emotional stress in general;
- never get up abruptly from the bed or from the sofa, this will worsen the headache;
- It is undesirable to travel anywhere, especially on airplanes and subways, and even more so to drive a car;
- You need to take sedatives, tea with mint, St. John's wort, lemon balm, if you have anxiety and irritability, as well as insomnia.
Yesterday I came across a video that was filmed in the program “About the Most Important Thing” and you know, a lot struck me there, it turns out that some people themselves are often to blame for the fact that they cannot cope with magnetic storms, and do you know why? Take 15 minutes of your time and watch this video, which is based on real facts and two life stories of young women.
And then you will definitely feel better!
Magnetic storms in March 2019 (schedule by day)
I would like to note that all magnetic fluxes are given from preliminary data and should not be taken as accurate information. After all, our world does not stand still; some terrestrial and cosmic phenomena cannot be predicted and seen. Perhaps in the future they will invent something like this in order to guess with 100% probability))).
Of course, not all of us will delve into these schedules, so I first wrote briefly the dates and then gave the schedule.
Important! In the future, stay tuned for site updates; information will appear monthly online. Therefore, I suggest adding the site to your bookmarks and when it is convenient for you, view this data.

The schedule for this period of time will be as follows. Pay attention to the red and yellow bars, if you see them on this chart, be alert to these dates:

How to understand this table and graph? To help you, I have compiled the following reminder:

With this I finish writing this post. In conclusion, I want to say, take care of yourself and your loved ones! After all, health comes first! If you have health, everything will happen! All the best and kindness! See you!
Sincerely, Ekaterina Mantsurova