Vector diagram. Addition of vibrations.
The solution to a number of problems in the theory of oscillations becomes much easier and more visual if the oscillations are represented graphically using the method vector diagrams. Let's choose some axis X. From the point 0 on the axis we plot the vector of length , which initially forms an angle with the axis (Fig. 2.14.1). If we bring this vector into rotation with angular velocity, then the projection of the end of the vector onto the axis X will change over time by law
![]() .
.
Consequently, the projection of the end of the vector onto the axis will perform a harmonic oscillation with an amplitude equal to length vector, with a circular frequency equal to the angular velocity of rotation of the vector, and with an initial phase, equal to the angle, which forms a vector with axis in starting moment time. Corner, formed by a vector with axis in at the moment time determines the phase of oscillation at this moment - .
From the above it follows that a harmonic oscillation can be represented using a vector, the length of which is equal to the amplitude of the oscillation, and its direction forms an angle with a certain axis equal to the phase of the oscillation. This is the essence of the vector diagram method.
Addition of oscillations of the same direction.
Consider the addition of two harmonic oscillations, the directions of which are parallel:
 . (2.14.1)
Resulting offset X will be the sum and . This will be an oscillation with amplitude .
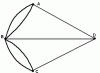
Let's use the vector diagram method (Fig. 2.14.2). In the figure, and ![]() - phases of the resulting and added oscillations, respectively. It is easy to see what can be found by adding the vectors and . However, if the frequencies of the added oscillations are different, then the resulting amplitude changes in magnitude over time and the vector rotates at a variable speed, i.e. the vibration will not be harmonic, but will represent some complex oscillatory process. For the resulting oscillation to be harmonic, the frequencies of the added oscillations must be the same
- phases of the resulting and added oscillations, respectively. It is easy to see what can be found by adding the vectors and . However, if the frequencies of the added oscillations are different, then the resulting amplitude changes in magnitude over time and the vector rotates at a variable speed, i.e. the vibration will not be harmonic, but will represent some complex oscillatory process. For the resulting oscillation to be harmonic, the frequencies of the added oscillations must be the same
and the resulting oscillation occurs with the same frequency
![]() .
.
From the construction it is clear that
Let us analyze expression (2.14.2) for the amplitude of the resulting oscillation. If the phase difference of the added oscillations is zero(oscillations are in phase), the amplitude is equal to the sum of the amplitudes of the added oscillations, i.e. has the maximum of possible value ![]() . If the phase difference is(oscillations are in antiphase), then the resulting amplitude is equal to the difference in amplitude, i.e. has the minimum possible value
. If the phase difference is(oscillations are in antiphase), then the resulting amplitude is equal to the difference in amplitude, i.e. has the minimum possible value ![]() .
.
Addition of mutually perpendicular vibrations.
Let the particle perform two harmonic oscillations with the same frequency: one along the direction, which we denote X, the other - in perpendicular direction y. In this case, the particle will move along a certain general case, curvilinear trajectory, the shape of which depends on the difference in the phases of the oscillations.
Let us choose the beginning of the time count so that the initial phase of one oscillation is equal to zero:
. (2.14.3)
To obtain the particle trajectory equation, it is necessary to exclude from (2.14.3) t. From the first equation, a. Means,  . Let's rewrite the second equation
 or
or
 .
.
Transferring the first term from the right side of the equation to the left, squaring the resulting equation and carrying out transformations, we obtain
 . (2.14.4)
This equation is the equation of an ellipse whose axes are rotated relative to the axes X And y at some angle. But in some special cases simpler results are obtained.
1. The phase difference is zero. Then from (2.14.4) we obtain
 or . (2.14.5)
This is the equation of a straight line (Fig. 2.14.3). Thus, the particle oscillates along this straight line with a frequency and amplitude equal to .
Complex amplitude method
The position of a point on the plane can be uniquely specified by a complex number:
If the point ($A$) rotates, then the coordinates of this point change in accordance with the law:
Let's write $z$ in the form:
where $Re(z)=x$, that is, the physical quantity x is equal to the real part complex expression(4). In this case, the modulus of the complex expression is equal to the oscillation amplitude - $a$, its argument equal to phase($(\omega )_0t+\delta $). Sometimes, when taking the real part of $z$, the sign of the operation Re is omitted and a symbolic expression is obtained:
Expression (5) should not be taken literally. Often formally simplified (5):
where $A=ae^(i \delta)$ is the complex amplitude of the oscillation. The complex nature of the amplitude $A$ means that the oscillation has an initial phase that is not equal to zero.
In order to reveal physical meaning expressions like (6), suppose that the oscillation frequency ($(\omega )_0$) has real and imaginary parts, and it can be represented as:
Then expression (6) can be written as:
If $(\omega )2>0,$ then expression (8) describes the damped harmonic vibrations with circular frequency $\omega1$ and damping exponent $(\omega )_2$. If $(\omega )_2
Comment
Many operations can be carried out on complex quantities. mathematical operations as if the quantities were real. Operations are possible if they themselves are linear and real (such as addition, multiplication, differentiation with respect to a real variable, and others, but not all). We must remember that complex quantities themselves do not correspond to any physical quantities.
Vector diagram method
Let point $A$ rotate uniformly along a circle of radius $r$ (Fig. 1), its rotation speed $(\omega )_0$.
Figure 1.
The position of point $A$ on the circle can be specified using the angle $\varphi $. This angle is equal to:
where $\delta =\varphi (t=0)$ is the rotation angle of the radius vector $\overrightarrow(r)$ at the initial time. If point $M$ rotates, then its projection onto the $axis X$ moves along the diameter of the circle, performing harmonic oscillations between points $M$ $N$. The abscissa of point $A$ can be written as:
In a similar way, you can represent fluctuations of any magnitude.
It is only necessary to accept the image of a quantity that oscillates with the abscissa of the point $A$, which rotates uniformly around the circle. You can, of course, use the ordinate:
Note 1
In order to represent damped oscillations, we must take not a circle, but a logarithmic spiral that approaches the focus. If the speed of approach of a point moving in a spiral is constant and the point moves towards the focus, then the projection of this point onto the X-axis will give formulas for damped oscillations.
Note 2
Instead of a point, you can use a radius vector, which will rotate uniformly around the origin. Then the quantity that performs harmonic oscillations will be depicted as a projection of this vector onto the X-axis. In this case, mathematical operations on the quantity $x$ are replaced by operations on a vector.
So the operation of summing two quantities:
it is more convenient to replace by summing two vectors (using the parallelogram rule). Vectors should be chosen so that their projections onto the chosen $axis X$ are the expressions $x_1\ and\ x_2$. Then the result of the operation of summing the vectors in the projection onto the x-axis will be equal to $x_1+\x_2$.
Example 1
Let us demonstrate the use of the vector diagram method.
So let's imagine complex numbers vectors on complex plane. A quantity that varies according to harmonic law, is represented by a vector that rotates with a frequency $(\omega )0$ around its origin counterclockwise. The length of the vector is equal to the amplitude of the oscillations.
Graphical method for solving, for example, the equation:
where $Z=R+i(\omega L-\frac(1)(\omega C))$ is the impedance, represented using Fig. 2. This picture shows vector diagram voltages in the AC circuit.

Figure 2.
Let's take into account that multiplying a complex value by a complex unit means rotating it by an angle of $90^0$ counterclockwise, and multiplying by ($-i$) by the same angle clockwise. From Fig. 2 it follows that:
where $-\frac(\pi )(2)\le \varphi \le \frac(\pi )(2).$ The change in the angle $\varphi $ depends on the relationship between the impedances of the circuit elements and the frequencies. External voltage can change in phase, from coinciding with the voltage on the inductance to coinciding with the voltage on the capacitor. This is usually expressed in the form of a relationship between the phases of the voltages on the circuit elements and the phase of the external voltage:
The phase of the voltage across the inductance $((U)L=i\omega LI)$ always leads the phase of the external voltage by an angle from $0$ to $\pi .$
The voltage phase on the capacitance $((U)C=-\frac(iI)(\omega C)$) always lags behind the external voltage phase by an angle between $0$ and --$\ \pi .$
In this case, the phase at the resistance can either lead or lag behind the phase of the external voltage by the angle between $\frac(\pi )(2)$ and $\frac(\pi )(2)$.
The vector diagram (Fig. 2) allows us to formulate the following:
The voltage phase across the inductance leads the current phase by $\frac(\pi )(2)$.
The voltage phase across the capacitance lags $\frac(\eth )(2)\ $from the current phase.
The phase of the voltage across the resistance coincides with the phase of the current.
Example 2
Exercise: Demonstrate that squaring cannot be applied to complex quantities as real numbers.
Solution:
Suppose we need to square real number$x$. Correct answer: $x^2$. Formally applicable complex method. Let's make a replacement:
$x\to x+iy$. Let's square the resulting expression and get:
\[(\left(x+iy\right))^2=x^2-y^2+2xyi\ \left(2.1\right).\]
The real part of expression (2.1) is equal to:
\[(Re\left(x+iy\right))^2=Re\left(x^2-y^2+2xyi\right)=x^2-y^2\ne x^2.\]
The reason for the error is that the squaring operation is not linear.

Harmonic vibrations
Those. in fact, the sine graph is obtained from the rotation of the vector, which is described by the formula:
F(x) = A sin (ωt + φ),
Where A is the length of the vector (oscillation amplitude), φ is the initial angle (phase) of the vector at zero time, ω - angular velocity rotation, which is equal to:
ω=2 πf, where f is the frequency in Hertz.
As we see, knowing the signal frequency, amplitude and angle, we can construct a harmonic signal.
The magic begins when it turns out that the representation of absolutely any signal can be represented as a sum (often infinite) of different sinusoids. In other words, in the form of a Fourier series.
I will give an example from the English Wikipedia. Let's take a sawtooth signal as an example.

Ramp signal
Its amount will be represented by the following formula:

If we add up one by one, take first n=1, then n=2, etc., we will see how our harmonic sinusoidal signal gradually turns into a saw:

This is probably most beautifully illustrated by one program I found on the Internet. It was already said above that the sine graph is a projection of a rotating vector, but what about more complex signals? This, oddly enough, is a projection of many rotating vectors, or rather their sum, and it all looks like this:

Vector drawing saw.
In general, I recommend going to the link yourself and trying to play with the parameters yourself and see how the signal changes. IMHO I have never seen a more visual toy for understanding.
It should also be noted that there is an inverse procedure that allows you to obtain frequency, amplitude and initial phase (angle) from a given signal, which is called the Fourier Transform.

Fourier series expansion of some well-known periodic functions(from here)
I won’t dwell on it in detail, but I will show how it can be applied in life. In the bibliography I will recommend where you can read more about the materiel.
Let's move on to practical exercises!
It seems to me that every student asks a question while sitting at a lecture, for example on mathematics: why do I need all this nonsense? And as a rule, having not found an answer in the foreseeable future, unfortunately, he loses interest in the subject. So I'll show you right away practical application this knowledge, and you will master this knowledge yourself :).
I will implement everything further on my own. I did everything, of course, under Linux, but did not use any specifics; in theory, the program will compile and run under other platforms.
First, let's write a program to generate an audio file. The wav file was taken as the simplest one. You can read about its structure.
In short, the structure of a wav file is described as follows: a header that describes the file format, and then there is (in our case) an array of 16-bit data (spike) with a length of: sampling_frequency*t seconds or 44100*t pieces.
An example was taken to generate a sound file. I modified it a little, corrected errors, and the final version with my edits is now on Github here
Let's generate a two-second sound file with a pure sine wave with a frequency of 100 Hz. To do this, we modify the program as follows:
#define S_RATE (44100) //sampling frequency #define BUF_SIZE (S_RATE*10) /* 2 second buffer */ …. int main(int argc, char * argv) ( ... float amplitude = 32000; //take the maximum possible amplitude float freq_Hz = 100; //signal frequency /* fill buffer with a sine wave */ for (i=0; i Please note that the formula for pure sine corresponds to the one we discussed above. The amplitude of 32000 (32767 could have been taken) corresponds to the value that a 16-bit number can take (from minus 32767 to plus 32767). As a result, we get the following file (you can even listen to it with any sound-reproducing program). Let's open this audacity file and see that the signal graph actually corresponds to a pure sine wave: Let's look at the spectrum of this sine (Analysis->Plot spectrum) A clear peak is visible at 100 Hz ( logarithmic scale). What is spectrum? This is the amplitude-frequency characteristic. There is also a phase-frequency characteristic. If you remember, I said above that to build a signal you need to know its frequency, amplitude and phase? So, you can get these parameters from the signal. IN in this case We have a graph of frequencies corresponding to amplitude, and the amplitude is not in real units, but in Decibels. I understand that in order to explain how the program works, it is necessary to explain what the fast Fourier transform is, and this is at least one more article. First, let's allocate the arrays: C = calloc(size_array*2, sizeof(float)); // array of rotation factors in = calloc(size_array*2, sizeof(float)); //input array out = calloc(size_array*2, sizeof(float)); //output array Let me just say that in the program we read data into an array of length size_array (which we take from the header of the wav file). While(fread(&value,sizeof(value),1,wav)) ( in[j]=(float)value; j+=2; if (j > 2*size_array) break; ) Array for fast conversion The Fourier must be a sequence (re, im, re, im,… re, im), where fft_size=1<< p - число точек БПФ. Объясняю нормальным языком: Int p2=(int)(log2(header.bytes_in_data/header.bytes_by_capture)); The logarithm of the number of bytes in the data divided by the number of bytes at one point. After this, we calculate the rotation factors: Fft_make(p2,c); // function for calculating rotation factors for FFT (the first parameter is a power of two, the second is an allocated array of rotation factors). And we feed our just array into the Fourier transformer: Fft_calc(p2, c, in, out, 1); //(one means we are getting a normalized array). At the output we get complex numbers of the form (re, im, re, im,… re, im). For those who don’t know what a complex number is, I’ll explain. It’s not for nothing that I started this article with a bunch of rotating vectors and a bunch of GIFs. So, a vector on the complex plane is determined by the real coordinate a1 and the imaginary coordinate a2. Or length (this is amplitude Am for us) and angle Psi (phase). Please note that size_array=2^p2. The first point of the array corresponds to a frequency of 0 Hz (constant), the last point corresponds to the sampling frequency, namely 44100 Hz. As a result, we must calculate the frequency corresponding to each point, which will differ by the delta frequency: Double delta=((float)header.frequency)/(float)size_array; //sampling frequency per array size. Alocate the amplitude array: Double * ampl; ampl = calloc(size_array*2, sizeof(double)); And look at the picture: amplitude is the length of the vector. And we have its projections onto the real and imaginary axis. As a result, we will have a right triangle, and here we remember the Pythagorean theorem, and count the length of each vector, and immediately write it into a text file: For(i=0;i<(size_array);i+=2) {
fprintf(logfile,"%.6f %f\n",cur_freq, (sqrt(out[i]*out[i]+out*out)));
cur_freq+=delta;
}
…
11.439514 10.943008
11.607742 56.649738
11.775970 15.652428
11.944199 21.872342
12.112427 30.635371
12.280655 30.329171
12.448883 11.932371
12.617111 20.777617
...
Now we feed the resulting program that sine sound file ./fft_an ../generate_wav/sin\ 100\ Hz.wav format: 16 bits, PCM uncompressed, channel 1, freq 44100, 88200 bytes per sec, 2 bytes by capture, 2 bits per sample, 882000 bytes in data chunk= 441000 log2=18 size array=262144 wav format Max Freq = 99.928 , amp =7216.136 And we get a text file of the frequency response. We build its graph using a gnuplot Script for construction: #! /usr/bin/gnuplot -persist set terminal postscript eps enhanced color solid set output "result.ps" #set terminal png size 800, 600 #set output "result.png" set grid xtics ytics set log xy set xlabel "Freq, Hz" set ylabel "Amp, dB" set xrange #set yrange plot "test.txt" using 1:2 title "AFC" with lines linestyle 1
!} Please note the limitation in the script on the number of points in X: set xrange . Our sampling frequency is 44100, and if we recall Kotelnikov’s theorem, then the signal frequency cannot be higher than half the sampling frequency, therefore we are not interested in a signal above 22050 Hz. Why this is so, I advise you to read in specialized literature. Note the sharp peak at 100 Hz. Don't forget that the axes are on a logarithmic scale! The wool on the right is what I think are Fourier transform errors (windows come to mind here). Come on! Let's look at the spectra of other signals! Double d_random(double min, double max) ( return min + (max - min) / RAND_MAX * rand(); ) It will generate a random number within the given range. As a result, main will look like this: Int main(int argc, char * argv) ( int i; float amplitude = 32000; srand((unsigned int)time(0)); //initialize the random number generator for (i=0; i Let's generate a file (I recommend listening to it). Let's look at it in audacity. Let's look at the spectrum in the audacity program. And let's look at the spectrum using our program: I would like to draw your attention to a very interesting fact and feature of noise - it contains the spectra of all harmonics. As can be seen from the graph, the spectrum is quite even. Typically, white noise is used for frequency analysis of bandwidth, such as audio equipment. There are other types of noise: pink, blue and others. Homework is to find out how they differ. Now let's look at another interesting signal - a meander. I gave above a table of expansions of various signals in Fourier series, you look at how the meander is expanded, write it down on a piece of paper, and we will continue. To generate a square wave with a frequency of 25 Hz, we once again modify our wav file generator: Int main(int argc, char * argv) ( int i; short int meandr_value=32767; /* fill buffer with a sine wave */ for (i=0; i As a result, we get an audio file (again, I advise you to listen), which you should immediately watch in audacity Let's not languish and look at its spectrum: It’s not very clear yet what it is... Let’s take a look at the first few harmonics: It's a completely different matter! Well, let's look at the sign. Look, we only have 1, 3, 5, etc., i.e. odd harmonics. We see that our first harmonic is 25 Hz, the next (third) is 75 Hz, then 125 Hz, etc., while our amplitude gradually decreases. Theory meets practice! This picture is just like the picture from Wikipedia, where for the example of a meander, not all frequencies are taken, but only the first few. The meander is also actively used in radio engineering (it must be said that this is the basis of all digital technology), and it is worth understanding that with long chains it can be filtered so that the mother does not recognize it. It is also used to check the frequency response of various devices. Another interesting fact is that TV jammers worked precisely on the principle of higher harmonics, when the microcircuit itself generated a meander of tens of MHz, and its higher harmonics could have frequencies of hundreds of MHz, exactly at the operating frequency of the TV, and the higher harmonics successfully jammed the TV broadcast signal. In general, the topic of such experiments is endless, and you can now continue it yourself. For those who don’t understand what we’re doing here, or vice versa, for those who understand but want to understand it even better, as well as for students studying DSP, I highly recommend this book. This is a DSP for dummies, which is the author of this post. There, complex concepts are explained in a language accessible even to a child. In conclusion, I would like to say that mathematics is the queen of sciences, but without real application, many people lose interest in it. I hope this post will encourage you to study such a wonderful subject as signal processing, and analog circuitry in general (plug your ears so your brains don’t leak out!). :) Tags: Harmonic oscillation x = a Cos(w t+ a) geometrically can be represented by a projection onto an arbitrary direction x vector rotating around a fixed axis with angular velocity w. The length of this vector is equal to the amplitude of the oscillation, and its initial direction forms with the axis x angle equal to the initial phase of oscillation - a. Using this geometric interpretation, we will solve the problem of adding two harmonic oscillations of the same frequency and direction. x = x 1 + x 2 = a 1 Cos(w t+ a 1) + a 2 Cos(w t+ a 2). Let's construct a vector (at an angle a 1 to the axis x), representing the first vibration. Let us add to it the vector forming an angle a 2 with the axis x(Fig. 12.8). The sum of the projections of these vectors onto the axis x is equal to the projection onto this axis of the vector equal to the sum and . x = x 1 + x 2 . Rice. 12.8 Let us bring this vector diagram into rotation with angular velocity w around an axis passing through the origin of coordinates - point O. In this case, the equality x = x 1 + x 2 will remain unchanged over time, although the projections themselves x, x 1 and x 2 will now pulsate according to a harmonic law with the same frequency w and with initial phases a, a 1 and a 2 - respectively. As a result of the addition of two vibrations: x 1 = a 1 Cos(w t+ a 1) and x 2 = a 2 Cos(w t+ a 2) a new oscillation occurs x = x 1 + x 2 = = a Cos(w t+ a), the frequency of which - w – coincides with the frequency of the added oscillations. Its amplitude is equal to the absolute value of the vector, and the initial phase a, as follows from Fig. 12.8, is equal to: To calculate the amplitude " A» total oscillation, we use the cosine theorem: The amplitude of the resulting oscillation depends not only on the amplitudes of the added oscillations A 1 and A 2, but also on the difference in their initial phases. Oscillation with maximum amplitude, A = a max = a 1 + a 2 occurs when adding in-phase oscillations, that is, when their initial phases coincide: a 1 = a 2. If the phase difference (a 2 – a 1) = p, then the amplitude of the total oscillation will be minimal a = a min = | a 1 – a 2 |. If the amplitudes of such oscillations occurring in antiphase are equal to ( a 1 = a 2), then the amplitude of the total oscillation will be equal to zero. We will often use this method of vector diagrams in the future when adding not only oscillations, but also waves. Lecture 13 “Mechanical vibrations” Lecture outline 1. Energy of a harmonic oscillator. 2. Natural damped oscillations. 3. Forced vibrations. Resonance. Amplitude and phase of forced oscillations. The same body can simultaneously participate in two or more movements. A simple example is the motion of a ball thrown at an angle to the horizontal. We can assume that the ball participates in two independent mutually perpendicular movements: uniform horizontally and uniformly variable vertically. One and the same body (material point) can participate in two (or more) oscillatory movements. Under addition of oscillations understand the definition of the law of resulting vibration if the oscillatory system simultaneously participates in several oscillatory processes. There are two limiting cases: the addition of oscillations in one direction and the addition of mutually perpendicular oscillations. 1. Addition of two oscillations of the same direction(co-directional oscillations) can be done using the vector diagram method (Figure 9) instead of adding two equations. Figure 2.1 shows the amplitude vectors A 1(t) and A 2 (t) added oscillations at an arbitrary moment of time t, when the phases of these oscillations are respectively equal The resulting oscillation Figure 2.1 – Addition of co-directional oscillations. Vector magnitude A(t) can be found using the cosine theorem: The phase of the resulting oscillation is given by the formula: If the frequencies of the added oscillations ω 1 and ω 2 are not equal, then both the phase φ(t) and the amplitude A(t) The resulting fluctuations will change over time. Added oscillations are called incoherent in this case. 2. Two harmonic vibrations x 1 and x 2 are called coherent, if their phase difference does not depend on time: But since, in order to fulfill the condition of coherence of these two oscillations, their cyclic frequencies must be equal. The amplitude of the resulting oscillation obtained by adding codirectional oscillations with equal frequencies (coherent oscillations) is equal to: The initial phase of the resulting oscillation is easy to find if you project the vectors A 1 and A 2 on the coordinate axes OX and OU (see Figure 9): So, the resulting oscillation obtained by adding two harmonic co-directional oscillations with equal frequencies is also a harmonic oscillation. 3. Let us study the dependence of the amplitude of the resulting oscillation on the difference in the initial phases of the added oscillations. If , where n is any non-negative integer (n = 0, 1, 2…), then If 4. Addition of co-directional oscillations with unequal but similar frequencies. The frequencies of the added oscillations are not equal, but the frequency difference An example of the addition of co-directed oscillations with similar frequencies is the movement of a horizontal spring pendulum, the spring stiffness of which is slightly different k 1 and k 2. Let the amplitudes of the added oscillations be the same The resulting oscillation is described by the equation: The resulting oscillation equation depends on the product of two harmonic functions: one with frequency The absolute value of the cosine is taken because the amplitude is a positive quantity. The nature of the dependence x res. during beating is shown in Figure 2.2. Figure 2.2 – Dependence of displacement on time during beating. The amplitude of the beats changes slowly with frequency. The absolute value of the cosine is repeated if its argument changes by π, which means that the value of the resulting amplitude will be repeated after a time interval τ b, called beat period(See Figure 12). The value of the beat period can be determined from the following relationship: The value is the beating period. Magnitude 1. A model on which the addition of mutually perpendicular oscillations can be demonstrated is presented in Figure 2.3. A pendulum (a material point of mass m) can oscillate along the OX and OU axes under the action of two elastic forces directed mutually perpendicularly. Figure 2.3 The folded oscillations have the form: The oscillation frequencies are defined as , , where , are the spring stiffness coefficients. 2. Consider the case of adding two mutually perpendicular oscillations with the same frequencies When a point is involved in two movements simultaneously, its trajectory can be different and quite complex. The equation for the trajectory of the resulting oscillations on the OXY plane when adding two mutually perpendicular ones with equal frequencies can be determined by excluding time t from the original equations for x and y: The type of trajectory is determined by the difference in the initial phases of the added oscillations, which depend on the initial conditions (see § 1.1.2). Let's consider the possible options. a) If (Figure 2.3 a). Figure 2.3.a Figure 2.3 b b) If (Figure 2.3b). In both cases (a, b), the resulting movement of the point will be an oscillation along a straight line passing through point O. The frequency of the resulting oscillation is equal to the frequency of the added oscillations ω 0, the amplitude is determined by the relation.
Pure tube sine
Spectrum graph![]()
is an array of complex numbers. I’m even afraid to imagine where the complex Fourier transform is used, but in our case, our imaginary part is equal to zero, and the real part is equal to the value of each point of the array.
Another feature of the fast Fourier transform is that it calculates arrays that are multiples only of powers of two. As a result, we must calculate the minimum power of two:
Vector on the complex plane
As a result, we get a file something like this:Let's try!
So (drum roll), we run the script and see:
Spectrum of our signalLet's indulge?
There is noise around...
First, let's build a noise spectrum. The topic is about noise, random signals, etc. worthy of a separate course. But we will touch on it lightly. Let's modify our wav file generation program and add one procedure: 
Signal in audacity
Spectrum
Our spectrumWhat about compote?

His Majesty - the meander or meander of a healthy person
Meander spectrum
First harmonics
Now attention! In real life, a square wave signal has an infinite sum of harmonics of higher and higher frequencies, but as a rule, real electrical circuits cannot pass frequencies above a certain frequency (due to the inductance and capacitance of the tracks). As a result, you can often see the following signal on the oscilloscope screen:
Smoker's meander
The sum of the first harmonics, and how the signal changes
BookConclusion
Good luck!
![]() .
.2.1. Addition of harmonic vibrations of one direction
![]() And
And ![]() . The addition of oscillations comes down to the definition
. The addition of oscillations comes down to the definition ![]() . Let's take advantage of the fact that in a vector diagram the sum of the projections of the vectors being added is equal to the projection of the vector sum of these vectors.
. Let's take advantage of the fact that in a vector diagram the sum of the projections of the vectors being added is equal to the projection of the vector sum of these vectors.![]() corresponds in the vector diagram to the amplitude vector and phase.
corresponds in the vector diagram to the amplitude vector and phase.
 .
. .
.![]() minimum. The added oscillations at the moment of addition were in antiphase. When the resulting amplitude is zero.
minimum. The added oscillations at the moment of addition were in antiphase. When the resulting amplitude is zero.![]() , That
, That ![]() , i.e. the resulting amplitude will be maximum. At the moment of addition, the added oscillations were in one phase, i.e. were in phase. If the amplitudes of the added oscillations are the same
, i.e. the resulting amplitude will be maximum. At the moment of addition, the added oscillations were in one phase, i.e. were in phase. If the amplitudes of the added oscillations are the same ![]() , That .
, That .![]() much less than both ω 1 and ω 2. The condition for the proximity of the added frequencies is written by the relations.
much less than both ω 1 and ω 2. The condition for the proximity of the added frequencies is written by the relations.![]() , and the initial phases are equal to zero. Then the equations of the added oscillations have the form:
, and the initial phases are equal to zero. Then the equations of the added oscillations have the form:![]() ,
, ![]() .
.![]() , the other with frequency
, the other with frequency ![]() , where ω is close to the frequencies of the added oscillations (ω 1 or ω 2). The resulting oscillation can be considered as harmonic oscillation with amplitude varying according to a harmonic law. This oscillatory process is called beats. Strictly speaking, the resulting oscillation in the general case is not a harmonic oscillation.
, where ω is close to the frequencies of the added oscillations (ω 1 or ω 2). The resulting oscillation can be considered as harmonic oscillation with amplitude varying according to a harmonic law. This oscillatory process is called beats. Strictly speaking, the resulting oscillation in the general case is not a harmonic oscillation.

 is the period of the resulting oscillation (Figure 2.4).
2.2. Addition of mutually perpendicular vibrations

![]() , which corresponds to the condition (identical springs). Then the equations of the added oscillations will take the form:
, which corresponds to the condition (identical springs). Then the equations of the added oscillations will take the form:![]()
![]() , where n = 0, 1, 2…, i.e. the added oscillations are in phase, then the trajectory equation will take the form:
, where n = 0, 1, 2…, i.e. the added oscillations are in phase, then the trajectory equation will take the form:

![]() (n = 0, 1, 2...), i.e. the added oscillations are in antiphase, then the trajectory equation is written as follows:
(n = 0, 1, 2...), i.e. the added oscillations are in antiphase, then the trajectory equation is written as follows: