One of the most important basic concepts of probability theory is the concept of a random variable.
A random variable is a quantity that, as a result of experiment, can take on one or another value, and it is not known in advance which one.
Examples of random variables:
1) number of hits with three shots;
2) the number of calls received on telephone exchange per day;
3) hit rate with 10 shots.
In all three of these examples, the random variables can take on separate, isolated values that can be enumerated in advance.
So, in example 1) these values are:
in example 2):
in example 3)
0; 0,1; 0,2; …; 1,0.
Such random variables that take only discrete values that can be enumerated in advance are called discontinuous or discrete random variables.
There are other types of random variables, for example:
1) abscissa of the point of impact when fired;
2) error in weighing the body on analytical balances;
3) the speed of the aircraft at the moment it reaches a given altitude;
4) the weight of a randomly taken grain of wheat.
The possible values of such random variables are not separated from each other; they continuously fill a certain gap, which sometimes has clearly defined boundaries, and more often – vague, vague boundaries.
Such random variables possible values which continuously fill a certain interval are called continuous random variables.
The concept of a random variable plays a very important role important role in probability theory. If the “classical” theory of probability operated primarily with events, then the modern theory of probability prefers, wherever possible, to operate with random variables.
Let us give examples of methods of transition from events to random variables typical for probability theory.
An experiment is carried out as a result of which some event may or may not appear. Instead of an event, we can consider a random variable, which is equal to 1 if the event occurs and equal to 0 if the event does not occur. The random variable is obviously discontinuous; it has two possible values: 0 and 1. This random variable is called the characteristic random variable of the event. In practice, it often turns out to be more convenient to operate with their characteristic random variables instead of events. For example, if a series of experiments are carried out, in each of which the occurrence of the event is possible, then the total number of occurrences of the event is equal to the sum of the characteristic random variables of the event in all experiments. When solving many practical problems Using this technique turns out to be very convenient.
On the other hand, very often in order to calculate the probability of an event it turns out to be convenient to associate this event with some kind of continuous random variable (or system of continuous variables).

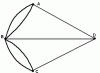
Let, for example, measure the coordinates of some object O in order to construct a point M, depicting this object in a panorama (scan) of the area. We are interested in the event that the error R in the position of point M will not exceed the specified value (Fig. 2.4.1). Let us denote random errors in measuring the coordinates of an object. Obviously, the event is equivalent to a random point M with coordinates falling within a circle of radius with a center at point O. In other words, for the event to occur, the random variables and must satisfy the inequality
The probability of an event is nothing more than the probability of inequality (2.4.1) being satisfied. This probability can be determined if the properties of random variables are known.
Such an organic connection between events and random variables is very characteristic of modern theory probabilities, which, wherever possible, passes from the “scheme of events” to the “scheme of random variables.” The latter scheme, compared to the first, is a much more flexible and universal apparatus for solving problems related to random phenomena.
Definition of a random variable. Many random events can be quantified by random variables.
Random is a quantity that takes values depending on a combination of random circumstances.
Random variables are: the number of patients at a doctor’s appointment, the number of students in the audience, the number of births in the city, life expectancy individual person, speed of a molecule, air temperature, error in measuring any quantity, etc. If you number the balls in an urn approximately as they do when playing a lotto draw, then randomly removing a ball from the urn will show a number that is a random variable.
There are discrete and continuous random variables.
A random variable is called discrete if it takes a countable set of values: the number of letters on an arbitrary page of a book, the energy of an electron in an atom, the number of hairs on a person’s head, the number of grains in ears of corn, the number of molecules in a given volume of gas, etc.
A continuous random variable takes any values within a certain interval: body temperature, grain weight V ears of wheat, the coordinate of the location where the bullet hit the target (we take the bullet as material point), etc.
Distribution of a discrete random variable. A discrete random variable is considered given if its possible values and the corresponding probabilities are indicated. Let us denote a discrete random variable X, its meanings x 1 x 2,…., and the probabilities P(x 1)= p 1, P(x 2)= p 2 etc. Collection X And P is called the distribution of a discrete random variable(Table 1).
Table 1
The random variable is the number of the sport in the game “Sportlo-10”. Total number species is 49. Indicate the distribution of this random variable (Table 3).
Table 3
Meaning 1 = 0 corresponds to the case in which the event three times in a row A didn't happen. The probability of this complex event, according to the probability multiplication theorem (2.6), is equal to
Meaning I = 1 refers to the case in which event A occurred in one of the three trials. Using formula (2.6) we obtain
Since when l = 1 two other complex events also occur: (A and A and A) and (A and A and A), then it is necessary, using the probability addition theorem (2.4), to obtain the total probability for l = 1, adding the previous expression three times:
Meaning I = 2 corresponds to the case in which event A occurred in two of the three trials. By reasoning similar to the above, we obtain full probability ad hoc:
At 1 = 3 event A appears in all three trials. Using the probability multiplication theorem, we find
IN general case binomial distribution allows you to determine the probability that event A will occur l times at n tests:
Based on many years of observations, calling a doctor to a given house is estimated with a probability of 0.5. Find the probability that four doctor calls will occur within six days; P(A)= 0,5, n = 6,1 = 4. T Let's use formula (2.10):
Numerical characteristics discrete random variable. In many cases, along with or instead of the distribution of a random variable, information about these quantities can be provided by numerical parameters called numerical characteristics of a random variable. Let's look at the most common of them.
The mathematical expectation (average value) of a random variable is the sum of the products of all its possible values
on the probabilities of these values:
Let at large number tests n discrete random variable X takes values x v x 2,..., x n respectively m 1, m g,..., t p once. The average value is
If n is great, then relative frequencies t 1 / p, t 2 / p,... will strive for probabilities, and average value- to the mathematical expectation. That's why mathematical expectation often identified with the average.
Find the mathematical expectation for a discrete random variable, which is given by the number on the edge when thrown dice(see Table 2).
We use formula (2.11):
Find the mathematical expectation for a discrete random variable, which is determined by the Sportloto circulation (see Table 3). According to formula (2.11), we find
Possible values of a discrete random variable are scattered around its mathematical expectation, some of them exceed M(X), part - less M(X). How to estimate the degree of dispersion of a random variable relative to its mean value? It may seem that to solve such a problem one should calculate the deviations of all random variables from its mathematical expectation X - M(X), and then find the mathematical expectation (average value) of these deviations: M[X - M(X)]. Taking the proof, we note that this value is equal to zero, since the deviations of random variables from the mathematical expectation are both positive and negative values. Therefore, it is advisable to take into account either absolute values deviations M[X - M(X)], or their squares M[X - M(X)] 2 . The second option turns out to be preferable, and this is how we come to the concept of dispersion of a random variable.
The variance of a random variable is the mathematical expectation of the squared deviation of a random variable from its mathematical expectation:
It means that the variance is equal to the difference between the mathematical expectation of the square of the random variable X and the square of its mathematical expectation.
Find the variance of the random variable, which is given by the number on the edge when throwing a die (see Table 2).
The mathematical expectation of this distribution is 3.5. Let us write down the values of the squares of the deviation of random variables from the mathematical expectation: (1 - 3.5) 2 = 6.25; (2 - 3.5) 2 = 2.25; (3 - 3.5) 2 = 0.25; (4 - 3.5) 2 = 0.25; (5 - 3.5) 2 = 2.25; (6 - 3.5) 2 = 6.25. Using formula (2.12), taking into account (2.11), we find the variance:

As follows from (2.12), the variance has the dimension of the square of the dimension of the random variable. In order to estimate the distance of a random variable in units of the same dimension, the concept is introduced standard deviation, which is understood as square root from dispersion:
Distribution and characteristics of a continuous random variable. A continuous random variable cannot be specified by the same distribution law as a discrete one. In this case, proceed as follows.
Let dP be the probability that a continuous random variable X takes values between X And X+ dx. Obviously, Irm is a longer interval dx, the greater the probability dP: dP ~ dx. Moreover, the probability must also depend on the random Quantity itself, near which the interval is located, therefore
Where f(x)- probability density, or probability distribution function. It shows how the probability related to the interval changes dx random variable, depending on the value of this variable itself:
Integrating expression (2.15) within the appropriate limits, we find the probability that the random variable takes any value in the interval (ab):
The normalization condition for a continuous random variable has the form
As can be seen from (2.19), this function is equal to the probability that the random variable takes values less than X:
For a continuous random variable, the mathematical expectation and variance are written respectively in the form
A random variable is a quantity whose value is obtained as a result of recalculation or measurements and cannot be unambiguously determined by the conditions of its occurrence.
That is, a random variable represents numerical random events.
Random variables are divided into two classes:
Discrete random variables - the values of these variables represent natural numbers, to which frequencies and probabilities are associated as individual events.
Continuous random variables - can take any value from a certain interval (interval). Considering that in the interval from X1 to X2 numerical values infinite set, then the probability that the random variable ХiЄ(Х1,Х2) will take a certain value is infinitesimal. Considering that it is impossible to list all the values of a continuous random variable, in practice they use the average value of the interval (X1,X2).
For discrete random variables, the function y=P(x) is called the distribution function of the random variable and has a graph - it is called the distribution polygon.
The following groups of numerical characteristics are distinguished: characteristics of position (mathematical expectation, mode, median, quantile, etc.), dispersion (dispersion, standard deviation, etc.), characteristics of the shape of the distribution density (indicator of asymmetry, kurtosis, etc.).
The mathematical expectation (the average value of the distribution) is a real number, determined depending on the type of SV X by the formula:
A mathematical expectation exists if the series (respectively, the integral) on the right side of the formula converges absolutely. If mX = 0, then CB X is called centered (denoted by ).
Properties of mathematical expectation:
where C is a constant;
M = C×M[X];
M = M[X]+M[Y],
for any CB X and Y;
M = M[X]×M[Y] + KXY,
where KXY = M - covariance of SV X and Y.
The initial moment of the kth order (k = 0, 1, 2, ...) of the distribution of SV X is called a real number, determined by the formula:
nk = M = 
The central moment of the kth order of the distribution of SV X is the number determined by the formula:
mk = M[(X-mX)k]= 
From the definitions of moments, in particular, it follows that: n0 = m0 = 1, n1 = mX, m2 = DX = sX2.
The SVNT mode is the real number Mo(X) = x*, defined as the maximum point of PR f(x). A mode can have a single value (unimodal distribution) or have multiple values (multimodal distribution).
The median of the SVNT is a real number Me(X) = x0 that satisfies the condition: P(X< x0} = P{X ³ x0} или F(x0) = 0,5.
A level p quantile is a real number tp that satisfies the equation: F(tp) = p. In particular, from the definition of median it follows that x0 = t0.5.
The variance of CB X is a non-negative number D[X] = DХ, defined by the formula:
DX = M[(X-mX)2] = M - mX2 = 
Dispersion exists if the series (respectively, the integral) on the right side of the equality converges. Dispersion properties:
D[C] = 0, where C is a constant;
D = C2×D[X];
the dispersion obviously does not change depending on the displacement of SV X;
D = D[X] + D[Y] + 2×KXY,
where KXY = M - covariance of SV X and Y;
![]()
Non-negative number sХ = called standard deviation SV X. It has the dimension SV X and defines a certain standard mean square dispersion interval, symmetrical with respect to the mathematical expectation. (The value sХ is sometimes called standard deviation). SV X is called standardized if mX = 0 and sX = 1. If the value X = const (i.e. X is not random), then D[X] = 0.
An indicator of PR asymmetry is the coefficient of asymmetry (“skewness”) of the distribution: A = m3/s3X. The indicator of the kurtosis of the PR is the coefficient of kurtosis (“peakedness”) of the distribution: E = (m4/s4X)-3. In particular for normal distribution E = 0.

An orderly collection of n random variables (RV) X1, X2, ..., Xn, considered together in this experience, is called an n-dimensional SV or a random vector and is denoted = (X1, X2, ..., Xn).
The distribution function (DF) of an n-dimensional random vector is a function of n real variables x1, x2, ..., xn, defined as the probability of joint fulfillment of n inequalities: F(x1, x2, ... xn) = P( X1< x1, X2 < x2,..., Xn < xn}. В частности, для двумерного случайного вектора (X, Y) по определению ФР имеем: F(x, y) = P{X < x, Y < y}. ФР F (х, у) обладает the following properties:
1 0 £ F(x, y) £ 1;
2 F(x, y) is a non-decreasing function of its arguments;
![]() 4.
4.
Property 4 is usually called the consistency condition. It means that the PDFs of individual components of a random vector can be found by passing to the limit from the function joint distribution these components. Hit Probability random point on the plane (X, Y) into a rectangle with sides parallel to the coordinate axes, can be calculated using DF using the formula:
P(x1 £ X< x2, y1 £ Y < y2} = F(x1, y1)+ F(x2, y2)- F(x1, y2)- F(x2, y1).
A two-dimensional random vector (X,Y) is called a discrete type random vector (DRV) if the set of its possible values G(x, y) is at most countable. Its distribution law can be specified by a two-dimensional table from the list of possible values of pairs of components ((хi, yi) | (хi, yi) О G(x, y)) and corresponding to each such pair of probabilities pij = P(X = xi, Y = yj ), satisfying the condition
A two-dimensional random vector (X, Y) is called a random vector of continuous type (CVNT) if there is such a non-negative function f(x, y) called the probability distribution density (PD) of the random vector such that:
f(x, y) = , then F(x, y) = .
PR probabilities have the following properties:
f(x, y) ³ 0, (x, y) О R2;
![]() - normalization condition.
- normalization condition.
PR probabilities of individual components of a random vector are expressed as integrals of joint density:
f(x) = f(y) = .
The probability of a random point falling into an arbitrary quadratable area S on a plane is determined by the formula
P((X, Y) О S)= .
The conditional probability density distribution of a random component X, provided that the component Y has taken a certain value y, is the function f(x/y) of the real variable x О R: f(x/y) = f(x, y)/f(y) . Defined similarly conditional density probability distribution of the random component Y, provided that the component X has taken a certain value x: f(y/x) = f(x, y)/f(x). SVs X1, X2, ..., Xn are called independent (together) if for events (Xi О Bi), i = 1, 2, ..., n, where B1, B2, ... Bn are subsets of the numerical straight line, the equality holds: P(X1 Î B1, X2 Î B2, ... Xn Î Bn) = P(X1 Î B1)× P(X2 Î B2)× ... ×P(Xn Î Bn).
Theorem: SV X1, X2, .... Xn are independent if and only if at any point x = (x1, x2, ..., xn) the equality holds: F(x1, x2, ..., xn ) = F(x1) × F (x2) × ... × F (xn) (or f(x1, x2, ..., xn) = f(x1) × f(x2) × ... × f (xn)).
For a two-dimensional random vector (X, Y), the following numerical characteristics are introduced.
The initial moment of order r + s of a random vector (X, Y) is the real number nr,s, defined by the formula:
nr,s = M = 
The initial moment nr,s exists if the integral (respectively, the series) on the right side of the equality converges absolutely. In particular, nr,0 = M - the corresponding initial moments components of X. A vector with non-random coordinates (mX, mY) = (n1,0, n0,1) is called the mathematical expectation of a random vector (X, Y) or the center of dispersion.
The central moment of order r + s of a random vector (X, Y) is the real number mr,s defined by the formula
mr,s = M[(X-mX)r (Y-mY)s] = 
The central moment mr,s exists if the integral (respectively, the series) on the right side of the equality converges absolutely. A vector with non-random coordinates (DX, DY) = (m2,0, m0,2) is called the variance of the random vector.
The central moment m1,1 is called correlation moment(by covariance): KXY = M = M[(X-mX)×(Y-mY)] = M-mX mY.
The correlation coefficient of two random components X and Y of a random vector is the normalized covariance
rXY = KXY/(sXsY).
Properties of covariance (and correlation coefficient).
The concept of a random variable. Discrete and continuous random variables. Probability distribution function and its properties. Probability distribution density and its properties. Numerical characteristics of random variables: mathematical expectation, dispersion and their properties, average standard deviation, mode and median; initial and central points, skewness and kurtosis. Numerical characteristics of the arithmetic mean of n independent random variables.The concept of a random variable
Random is a quantity that, as a result of testing, takes on one or another (but only one) possible value, unknown in advance, varying from test to test and depending on random circumstances. Unlike random event, which is qualitative characteristics random result test, a random variable characterizes the test result quantitatively. Examples of a random variable include the size of the workpiece, the error in the measurement result of any parameter of a product or environment. Among the random variables encountered in practice, two main types can be distinguished: discrete and continuous.
Discrete is a random variable that takes a finite or infinite countable set of values. For example: hit rate with three shots; number of defective products in a batch of n pieces; the number of calls received at the telephone exchange during the day; the number of failures of device elements over a certain period of time when testing it for reliability; number of shots until the first hit on the target, etc.
Continuous is a random variable that can take any value from some finite or infinite interval. Obviously, the number of possible values of a continuous random variable is infinite. For example: error when measuring the radar range; uptime of the microcircuit; manufacturing error of parts; salt concentration in sea water etc.
Random variables are usually denoted by the letters X,Y, etc., and their possible values by x,y, etc. To define a random variable, it is not enough to list all its possible values. It is also necessary to know how often certain of its values may appear as a result of tests under the same conditions, i.e., it is necessary to set the probabilities of their occurrence. The set of all possible values of a random variable and their corresponding probabilities constitutes the distribution of the random variable.
Laws of random variable distribution
Law of distribution A random variable is the correspondence between possible values of a random variable and their corresponding probabilities. A random variable is said to obey this law distributions. Two random variables are called independent, if the distribution law of one of them does not depend on what possible values the other quantity took. Otherwise, the random variables are called dependent. Several random variables are called mutually independent, if the laws of distribution of any number of them do not depend on what possible values the other quantities took.
The distribution law of a random variable can be specified in the form of a table, distribution function or distribution density. A table containing possible values of a random variable and the corresponding probabilities is simplest form specifying the distribution law of a random variable.
\begin(array)(|c|c|c|c|c|c|c|)\hline(X)&x_1&x_2&x_3&\cdots&x_(n-1)&x_n\\\hline(P)&p_1&p_2&p_3&\cdots&p_(n-1 )&p_n\\\hline\end(array)
The tabular specification of the distribution law can only be used for a discrete random variable with finite number possible values. The tabular form of specifying the law of a random variable is also called a distribution series.
For clarity, the distribution series is presented graphically. At graphic representation V rectangular system coordinates, the abscissa axis shows all possible values of the random variable, and the ordinate axis shows the corresponding probabilities. Points (x_i,p_i) connected by straight line segments are called distribution polygon(Fig. 5). It should be remembered that connecting the points (x_i,p_i) is performed only for the purpose of clarity, since in the intervals between x_1 and x_2, x_2 and x_3, etc. there are no values that the random variable X can take, so the probability of its appearance in these intervals are equal to zero.
A distribution polygon, like a distribution series, is one of the forms of specifying the distribution law of a discrete random variable. They may have different shape, however, everyone has one common property: the sum of the ordinates of the vertices of the distribution polygon, which is the sum of the probabilities of all possible values of the random variable, is always equal to one. This property follows from the fact that all possible values of the random variable X form full group incompatible events, the sum of the probabilities is equal to one.
Probability distribution function and its properties
The distribution function is the most general form setting the distribution law. It is used to specify both discrete and continuous random variables. It is usually denoted F(x) . Distribution function determines the probability that the random variable X takes values less than a fixed value real number x , i.e. F(x)=P\(X
The geometric interpretation of the distribution function is very simple. If a random variable is considered as a random point X of the Ox axis (Fig. 6), which as a result of the test can take one or another position on the axis, then the distribution function F(x) is the probability that the random point X as a result of the test will fall to the left points x.

For a discrete random variable X, which can take values , the distribution function has the form
F(x)=\sum\limits_(x_i A continuous random variable has a continuous distribution function; the graph of this function has the shape of a smooth curve (Fig. 8). Let's consider the general properties of distribution functions. Property 1. The distribution function is non-negative, a function between zero and one: 0\leqslant(F(x))\leqslant1 The validity of this property follows from the fact that the distribution function F(x) is defined as the probability of a random event consisting in the fact that X Property 2. The probability of a random variable falling into the interval [\alpha;\beta) is equal to the difference between the values of the distribution function at the ends of this interval, i.e. P\(\alpha\leqslant(X)<\beta\}=F(\beta)-F(\alpha)
It follows that the probability of any individual value of a continuous random variable is zero. Property 3. The distribution function of a random variable is a non-decreasing function, i.e. F(\beta)\geqslant(F(\alpha)). Property 4. At minus infinity the distribution function is equal to zero, and at plus infinity it is equal to one, i.e. \lim_(x\to-\infty)F(x)=0 And \lim_(x\to+\infty)F(x)=1. Example 1. The distribution function of a continuous random variable is given by the expression F(x)=\begin(cases)0,&x\leqslant1\\a(x-1)^2,&1 Find coefficient a and plot F(x) . Determine the probability that the random variable X will take a value on the interval as a result of the experiment. Solution. Since the distribution function of a continuous random variable X is continuous, then for x=3 we obtain a(3-1)^2=1. Hence a=\frac(1)(4) . The graph of the function F(x) is shown in Fig. 9. Based on the second property of the distribution function, we have P\(1\leqslant(X)<2\}=F(2)-F(1)=\frac{1}{4}.
The distribution function of a continuous random variable is its probabilistic characteristic. But it has the disadvantage that it is difficult to judge from it the nature of the distribution of a random variable in a small neighborhood of one or another point on the numerical axis. A more clear idea of the nature of the distribution of a continuous random variable is given by a function called the probability distribution density, or differential distribution function of a random variable. Distribution density f(x) is equal to the derivative of the distribution function F(x), i.e. F(x)=F"(x). The meaning of the distribution density f(x) is that it indicates how often a random variable X appears in some neighborhood of a point x when repeating experiments. A curve depicting the distribution density f(x) of a random variable is called distribution curve. Let's consider distribution density properties. Property 1. The distribution density is non-negative, i.e. F(x)\geqslant0. Property 2. The distribution function of a random variable is equal to the integral of the density in the interval from -\infty to x, i.e. F(x)=\int\limits_(-\infty)^(x)f(x)\,dx. Property 3. The probability of a continuous random variable X falling into a section (\alpha;\beta) is equal to the integral of the distribution density taken over this section, i.e. P\(\alpha\leqslant(X)\leqslant\beta\)=\int\limits_(\alpha)^(\beta)f(x)\,dx. Property 4. The integral over infinite limits of the distribution density is equal to unity: \int\limits_(-\infty)^(+\infty)f(x)\,dx=1. Example 2. Random variable X is subject to a distribution law with density F(x)=\begin(cases)0,&x<0\\a\sin{x},&0 Determine coefficient a; construct a distribution density graph; find the probability of a random variable falling into the area from 0 to \frac(\pi)(2), determine the distribution function and construct its graph. \int\limits_(-\infty)^(+\infty)f(x)\,dx=a\int\limits_(0)^(\pi)\sin(x)\,dx=\Bigl.(- a\cos(x))\Bigl|_(0)^(\pi)=2a. Taking into account property 4 of the distribution density, we find a=\frac(1)(2) . Therefore, the distribution density can be expressed as follows: F(x)=\begin(cases)0,&x<0\\\dfrac{1}{2}\sin{x},&0 Distribution density graph in Fig. 10. By property 3, we have P\!\left\(0 To determine the distribution function, we use property 2: F(x)=\frac(1)(2)\int\limits_(0)^(x)\sin(x)\,dx=\Bigl.(\-\frac(1)(2)\cos( x))\Bigl|_(0)^(x)=\frac(1)(2)-\frac(1)(2)\cos(x). Thus we have F(x)=\begin(cases)0,&x<0\\\dfrac{1}{2}-\dfrac{1}{2}\cos{x},&0 The distribution function graph is shown in Fig. 11 The distribution law fully characterizes a random variable from a probabilistic point of view. But when solving a number of practical problems, there is no need to know all possible values of a random variable and the corresponding probabilities, but it is more convenient to use some quantitative indicators. Such indicators are called numerical characteristics of a random variable. The main ones are mathematical expectation, dispersion, moments of various orders, mode and median. The mathematical expectation is sometimes called the average value of a random variable. Consider a discrete random variable X taking the values x_1,x_2,\ldots,x_n with probabilities accordingly p_1,p_2,\ldots,p_n Let us determine the arithmetic mean of the values of a random variable, weighted by the probabilities of their occurrence. Thus, we calculate the average value of a random variable, or its mathematical expectation M(X) : M(X)=\frac(x_1p_1+x_2p_2+\cdots+x_np_n)(p_1+p_2+\cdots+p_n)=\frac(\sum\limits_(i=1)^(n)x_ip_i)(\sum\limits_( i=1)^(n)p_i). Considering that \sum\limits_(i=1)^(n)p_i=1 we get M(X)=\sum\limits_(i=1)^(n)x_ip_i).~~~~~~~(4.1) So, mathematical expectation A discrete random variable is the sum of the products of all its possible values and the corresponding probabilities. For a continuous random variable, the mathematical expectation M(X)=\int\limits_(-\infty)^(\infty)xf(x)\,dx. Expectation of a continuous random variable X, the possible values of which belong to the segment, M(X)=\int\limits_(a)^(b)xf(x)\,dx.~~~~~~~(4.2) Using the probability distribution function F(x), the mathematical expectation of a random variable can be expressed as follows: M(X)=\int\limits_(-\infty)^(\infty)x\,d(F(x)). Property 1. The mathematical expectation of the sum of two random variables is equal to the sum of their mathematical expectations: M(X+Y)=M(X)+M(Y). Property 2. The mathematical expectation of the product of two independent random variables is equal to the product of their mathematical expectations: M(XY)=M(X)M(Y). Property 3. The mathematical expectation of a constant value is equal to the constant itself: M(c)=c. Property 4. The constant multiplier of a random variable can be taken out of the sign of the mathematical expectation: M(cX)=cM(X). Property 5. The mathematical expectation of the deviation of a random variable from its mathematical expectation is equal to zero: M(X-M(X))=0. Example 3. Find the mathematical expectation of the number of defective products in a sample of five products, if the random variable X (the number of defective products) is given by a distribution series. \begin(array)(|c|c|c|c|c|c|c|)\hline(X)&0&1&2&3&4&5\\\hline(P)&0,\!2373&0,\!3955&0,\!2637&0,\ !0879&0,\!0146&0,\!0010\\\hline\end(array) Solution. Using formula (4.1) we find M(X)=0\cdot0,\!2373+1\cdot0,\!3955+2\cdot0,\!2637+3\cdot0,\!0879+4\cdot0,\!0146+5\cdot0,\ !0010 =1,\!25.
Mode M_0 of a discrete random variable its most probable value is called. Mode M_0 of a continuous random variable its value is called, which corresponds to the largest value of the distribution density. Geometrically, the mode is interpreted as the abscissa of the global maximum point of the distribution curve (Fig. 12). Median M_e of a random variable its value is called for which the equality is true P\(X From a geometric point of view, the median is the abscissa of the point at which the area of the figure, bounded by the probability distribution curve and the abscissa, is divided in half (Fig. 12). Since the entire area bounded by the distribution curve and the x-axis is equal to unity, the distribution function at the point corresponding to the median is equal to 0.5, i.e. F(M_e)=P\(X Using dispersion and standard deviation, one can judge the dispersion of a random variable around the mathematical expectation. As a measure of the dispersion of a random variable, the mathematical expectation of the squared deviation of the random variable from its mathematical expectation is used, which is called variance of a random variable X and denote D[X] : D[X]=M((X-M(X))^2). For a discrete random variable, the variance is equal to the sum of the products of the squared deviations of the values of the random variable from its mathematical expectation and the corresponding probabilities: D[X]=\sum\limits_(i=1)^(n)(x_i-M(X))^2p_i. For a continuous random variable whose distribution law is specified by the probability distribution density f(x) , the variance D[X]=\int\limits_(-\infty)^(+\infty)(x-M(X))^2f(x)\,dx. The dimension of variance is equal to the square of the dimension of the random variable and therefore cannot be interpreted geometrically. The standard deviation of a random variable, which is calculated by the formula, does not have these disadvantages \sigma=\sqrt(D[X]). Property 1. The variance of the sum of two independent random variables is equal to the sum of the variances of these variables: D=D[X]+D[Y]. Property 2. The variance of a random variable is equal to the difference between the mathematical expectation of the square of the random variable X and the square of its mathematical expectation: D[X]=M(X^2)-(M(X))^2.~~~~~~~(4.3). Property 3. The variance of a constant value is zero: D[c]=0. Property 4. The constant multiplier of a random variable can be taken out of the dispersion sign by first squaring it: D=c^2D[X]. Property 5. The variance of the product of two independent random variables X and Y is determined by the formula D=D[X]D[Y]+(M(X))^2D[Y]+(M(X))^2D[X]. Example 4. Calculate the variance of the number of defective products for the distribution of Example 3. Solution. By definition of variance A generalization of the basic numerical characteristics of a random variable is the concept of moments of a random variable. Initial moment of qth order a random variable is the mathematical expectation of the value X^q: The initial moment of the first order represents the mathematical expectation, and the central moment of the second order represents the variance of the random variable. The third-order normalized central moment characterizes the skewness or asymmetry of the distribution ( asymmetry coefficient): A_s=\frac(\mu_(()_3))(\sigma^3). The normalized central moment of the fourth order serves as a characteristic of the peakedness or flatness of the distribution ( excess): E=\frac(\mu_(()_4))(\sigma^4)-3. Example 5. Random variable X is specified by the probability distribution density F(x)=\begin(cases)0,&x<0;\\ax^2,&0 Find coefficient a, mathematical expectation, dispersion, skewness and kurtosis. Solution. The area limited by the distribution curve is numerically equal to \int\limits_(0)^(2)f(x)\,dx=a\int\limits_(0)^(2)x^2\,dx=\left.(a\,\frac(x^ 3)(3))\right|_(0)^(2)=\frac(8)(3)\,a. Considering that this area should be equal to unity, we find a=\frac(3)(8) . Using formula (4.2) we find the mathematical expectation: M(X)=\int\limits_(0)^(2)xf(x)\,dx=\frac(3)(8)\int\limits_(0)^(2)x^3\,dx= \left.(\frac(3)(8)\cdot\frac(x^4)(4))\right|_(0)^(2)=1,\!5. Let us determine the dispersion using formula (4.3). To do this, we first find the mathematical expectation of the square of the random variable: M(X^2)=\int\limits_(0)^(2)x^2f(x)\,dx=\frac(3)(8)\int\limits_(0)^(2)x^4 \,dx=\left.(\frac(3)(8)\cdot\frac(x^5)(5))\right|_(0)^(2)=2,\!4. Thus, \begin(aligned)D(X)&=M(X^2)-(M(X))^2=2,\!4-(1,\!5)^2=0,\!15;\ \ \sigma(X)&=\sqrt(D(X))=\sqrt(0,\!15)\approx0,\!3873.\end(aligned) Using the initial moments, we calculate the central moments of the third and fourth order: \begin(aligned)\nu_1&=M(X)=1,\!5;\quad\nu_2=M(X^2)=2,\!4.\\ \nu_3&=M(X^3)=\ int\limits_0^2(x^3f(x)\,dx)=\frac(3)(8)\int\limits_0^2(x^5\,dx)=\left.(\frac(3)( 8)\cdot\frac(x^6)(6))\right|_0^2=4;\\ \nu_4&=M(X^4)=\int\limits_0^2(x^4f(x)\ ,dx)=\frac(3)(8)\int\limits_0^2(x^6\,dx)=\left.(\frac(3)(8)\cdot\frac(x^7)(7 ))\right|_0^2\approx6,\!8571;\\ \mu_3&=\nu_3-3\nu_1\nu_2+2\nu_1^3=4-3\cdot1,\!5\cdot2,\!4 +2\cdot(1,\!5)^3=-0,\!05.\\ \mu_4&=\nu_4-4\nu_1\nu_3+6\nu_1^2\nu_2-3\nu_1^4=\ \&=6,\!8571-4\cdot1,\!5\cdot4+6\cdot(1,\!5)^2\cdot2,\!4-3\cdot(1,\!5)^4 =0,\!0696.\\ A_s&=\frac(\mu_3)(\sigma^3)=-\frac(0,\!05)((0,\!3873)^3)=-0,\ !86.\\ E&=\frac(\mu_4)(\sigma^4)-3=\frac(0,\!0696)((0,\!3873)^4)-3=-0,\! 093.\end(aligned) Let x_1,x_2,\ldots,x_n- values of the random variable X obtained in n independent tests. The mathematical expectation of a random variable is M(X) , and its variance is D[X] . These values can be considered as independent random variables X_1,X_2,\ldots,X_n with the same mathematical expectations and variances: M(X_i)=M(X); \quad D=D[X],~~i=1,2,\ldots,n. The arithmetic mean of these random variables \overline(X)=\sum\limits_(i=1)^(n)\frac(X_i)(n). Using the properties of mathematical expectation and dispersion of a random variable, we can write: \begin(aligned)M(\overline(X))&=M\!\left(\frac(1)(n)\sum\limits_(i=1)^(n)X_i\right)=\frac( 1)(n)\sum\limits_(i=1)^(n)M(X_i)=M(X).~~~~~~~(4.4)\\ D[\overline(X)]&= D\!\left[\frac(1)(n)\sum\limits_(i=1)^(n)X_i\right]=\frac(1)(n^2)\sum\limits_(i=1 )^(n)D=\frac(D[X])(n).~~~~~~~(4.5)\end(aligned) If classical probability theory studied mainly events and the probability of their occurrence (occurrence), then modern probability theory studies random phenomena and their patterns using random variables. The concept of a random variable is thus fundamental in probability theory. Even earlier, events were held that consisted of the appearance of one or another number. For example, when throwing a dice, the numbers 1, 2, 3, 4, 5, 6 could appear. It is impossible to determine in advance the number of points that appear, since it depends on many random reasons that cannot be completely taken into account. In this sense, the number of points is a random value, and the numbers 1, 2, 3, 4, 5 and 6 are possible values this value. Random variable is a quantity that, as a result of experiment, takes on one or another (and one and only one) possible numerical value, unknown in advance and depending on random reasons that cannot be taken into account in advance. Random variables are usually denoted by capital letters, and their possible values by corresponding lowercase letters. For example, if a random variable has three possible values, then they are accordingly denoted as follows:. For convenience, we will write: EXAMPLE 1. The number of boys born among one hundred newborns is a random value, which has the following possible values: 0, 1, 2, ..., 100. EXAMPLE 2. The distance that a projectile will travel when fired from a gun is also a random value. Indeed, the distance depends not only on the installation of the sight, but also on many other reasons (wind strength and direction, temperature, etc.) that cannot be fully taken into account. Possible values of this quantity obviously belong to a certain gap (interval). Note that each random event can be associated with some random variable that takes values from R. For example, experience
- shot at a target; event
- hitting the target; random variable
- number of hits on the target. Let's return to the examples given above. In the first of them, the random variable could take one of the following possible values: 0, 1, 2,..., 100. These values are separated from one another by intervals in which there are no possible values. Thus, in this example, the random variable takes on individual, isolated, possible values. In the second example, the random variable could take any of the interval values. Here it is impossible to separate one possible value from another by an interval that does not contain possible values of the random variable. Already from what has been said, we can conclude that it is advisable to distinguish between random variables that take only individual, isolated values and random variables whose possible values completely fill a certain interval. Discrete (
intermittent
)
A random variable is a random variable that takes on a finite or countable set of 1 different values. In other words, it is a random variable that takes on separate, isolated possible values with certain probabilities. The number of possible values of a discrete random variable can be finite or infinite. Continuous
called a random variable that can take all values from some finite or infinite interval of the real number axis. Obviously, firstly, the number of possible values of a continuous random variable is infinite. Secondly, a discrete random variable is a special case of a continuous random variable. Probability distribution law I. Law of probability distribution of a discrete random variable
At first glance, it may seem that to define a discrete random variable it is enough to list all its possible values. In reality, this is not the case: different random variables can sometimes have the same lists of possible values, but the corresponding probabilities of these values can be different. Therefore, for a complete characterization, it is not enough to know the values of a random variable; you also need to know how often these values occur in an experiment when it is repeated, i.e. you also need to indicate the probability of their occurrence. Consider the random variable Then: a correspondence that establishes a connection between possible values of a random variable and their probabilities is calledlaw of probability distribution of a random variable
, or simply – the law of distribution of a random variable. The probability distribution law of a given random variable can be specified tabularly (distribution series), analytically (in the form of a formula) and graphically. When specifying the law of distribution of a discrete random variable in a table, the first row of the table contains possible values, and the second - their probabilities, i.e. For purposes of clarity, the distribution law of a discrete random variable can also be depicted graphically, for which points are constructed in a rectangular coordinate system and then connected by line segments. The resulting figure is called a distribution polygon. In this case, the sum of the ordinates of the constructed polygon is equal to one. Analytically, the law of distribution of a discrete random variable can be written, for example, using Bernoulli’s formula for a scheme for repeating independent experiments. So, if we denote a random variable, which is the number of defective parts in the sample, by , then its possible values will be 0, 1, 2, . . . ,. Then, obviously, Bernoulli’s formula will establish a relationship between the values and the probability() of their occurrence, where what determines the distribution law of a given random variable. II.
Law of probability distribution of a continuous random variable
Recall that a discrete random variable is specified by a list of all its possible values and their probabilities. This method of setting is not general: it is not applicable, for example, for continuous random variables. Indeed, consider a random variable whose possible values completely fill the interval. Is it possible to list all possible values? Obviously this cannot be done. This example indicates the advisability of giving a general way to specify any types of random variables (as already noted, a discrete random variable is a special case of a continuous random variable). For this purpose, they introduce integral function distributions. Let be a variable taking arbitrary real values (on the axis:). Consider the event that a random variable will take on a smaller value. Then, the probability cumulative distribution function
is called a function that determines for each value R the probability that the random variable will take a value smaller, i.e. Geometrically, this equality can be interpreted as follows: there is a probability that a random variable will take on a value that is represented on the number axis by a point lying to the left of the point. Properties of the integral function:
The proof of this property follows from the definition of an integral function as a probability: probability is always a non-negative number not exceeding one. Indeed, let be the event that the random variable takes on a smaller value; similarly,
That's what needed to be shown. This property is quite obvious. So, if
But We will mainly study such continuous random variables whose distribution functions are continuous.
For a continuous random variable, it is more obvious not the integral, but the differential distribution function or the so-called distribution density of the random variable.
where inequality x_i 


Probability distribution density and its properties

Numerical characteristics of random variables
Properties of mathematical expectation

Properties of dispersion of random variables
Numerical characteristics of the arithmetic mean of n independent random variables
Go to next section
Multivariate random variables Javascript is disabled in your browser.
To perform calculations, you must enable ActiveX controls!
![]() .
.![]() . The appearance of each of their possible values indicates that one of the events that form the complete group 2 has occurred. Let us assume that the probabilities of these events are known:
. The appearance of each of their possible values indicates that one of the events that form the complete group 2 has occurred. Let us assume that the probabilities of these events are known:![]() ,
. . . ,
,
. . . ,
![]() ,
,

![]() ,
,![]() event depends on, i.e. is a function of. This function is usually denoted by and called the distribution function of a random variable or, also, the integral distribution function. In other words:
event depends on, i.e. is a function of. This function is usually denoted by and called the distribution function of a random variable or, also, the integral distribution function. In other words:![]() .
.
 – an event consisting in the fact that a random variable will take on a smaller value. In other words:
![]() or, what is the same:
or, what is the same:![]() - a reliable event, and
- a reliable event, and ![]() is an impossible event, then
is an impossible event, then

![]() ,
,![]() As a result, we can write:, which is what we needed to show.
As a result, we can write:, which is what we needed to show.
 .
.