An update of the HadCRUT global database, created in the UK based on climate observations over the past 160 years, showed that the warmest year on record was 2010, and not 1998, as previously thought. Phil Jones, director of the Climate Center, explained the reason for updating the register in 2012: “The base is based on observations, and we previously indicated that it may not fully reflect changes in the Arctic, because we had very little data from this region, - In the latest version we included observational data from more than 400 weather stations in the Arctic, Russia and Canada.”
The HadCRUT database is considered one of the three main global temperature registers (the other two are compiled in the USA). It has been maintained since 1850 by the Hadley Center of the UK Meteorological Service (Hadley Centre) and the Climate Center of the University of East Anglia (Climatic Research Unit, or CRU).
Another change to the database in 2012 is to take into account different ways of measuring ocean surface temperature. This caused changes in the data for several years of observation, especially in the middle of the 20th century. The head of the climate monitoring office, Peter Scott, explained that an example of changes in the database is data taken from the archives of the Second World War. The fact is that some measurements of sea surface temperature were made from baskets attached to the side of the ships, others from buoys and special compartments. The study found that the temperature readings in the overboard basket were generally lower due to the cooling of the thermometers by the water jet. Scientists had to introduce a correction for the method of measurement, which affected the change in the base.
Below is a table of temperature anomalies in recent years. The anomaly is the difference between the temperature of a particular year and the average temperature for the period 1961 - 1990.
|
Average annual temperature anomalies for the old base (HadCRUT3) and new base in 2012 (HadCRUT4) |
|||||
|
HadCRUT3 |
Anomaly (°C) |
HadCRUT4 |
Anomaly (°C) |
Uncertainty (HadCRUT4) (°C) |
|
You can view a presentation on database changes on the MetOffice website at http://www.metoffice.gov.uk/news/releases/archive/2012/hadcrut-updates
Despite the revision of the year of maximum temperature, the scientists of the Center for the Meteorological Service still recognize that that since 1900 the average temperature on the planet has risen by 0.75 degrees Celsius.
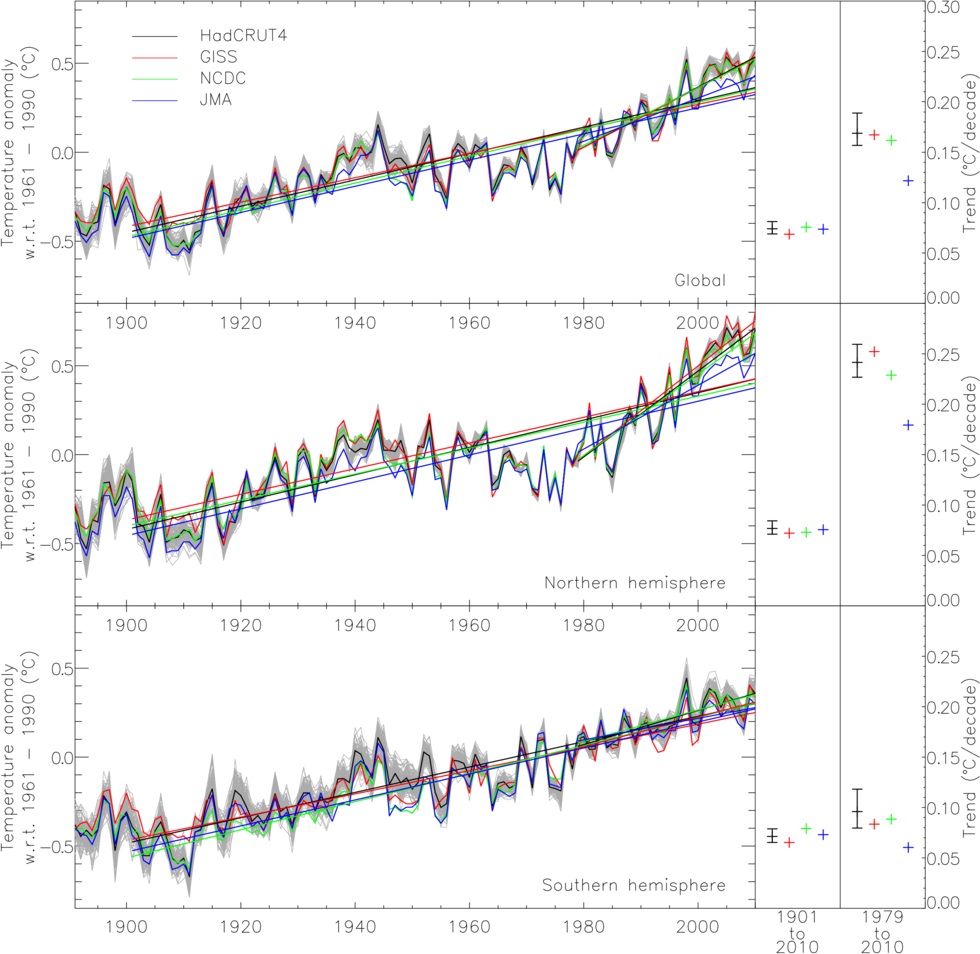
Below is a graph of changes in the average annual temperature on Earth according to MetOffice. Top graph - global temperature anomalies, middle graph - temperature anomalies in the northern hemisphere, bottom graph - temperature anomalies in the southern hemisphere. The trend lines were constructed using the least squares method for the period from 1901 to 2010 and for the period from 1979 to 2010. The trend of accelerating temperature increase is especially noticeable in the northern hemisphere.