Fourier transform
When using Fourier transforms, the image is represented as a sum of complex exponential functions variables of amplitude, frequency and phase. The Fourier transform plays very important role in many areas of image processing, including enhancement, analysis, restoration and compression.
- Basic definitions of the Fourier transform
- Discrete Fourier transform, including fast Fourier transform
- Application of the Fourier transform (some examples practical application Fourier transform)
Basic definitions of the Fourier transform
If ƒ(m,n) is a function of two discrete spatial variables m and n, then the two-dimensional Fourier transform of the function ƒ(m,n) can be represented by the following expression
The variables are angular frequencies. Thus, represents a function ƒ(m,n) V frequency domain. is a complex-valued function with corresponding frequencies. The frequencies are within the range , . Note that F(0,0) is represented as the sum of all variables ƒ(m,n). For this reason F(0,0) is often called the constant component of the Fourier transform.
The inverse two-dimensional Fourier transform is represented by the expression
Those. this expression represents ƒ(m,n) in the form of a sum finite number complex exponential functions (sine waves) with different frequencies. Amplitude and phase determine the contribution of frequencies to the representation.
Visualization of the Fourier transform
In illustrating the Fourier transform, let us assume that the function ƒ(m,n) equals 1 and is represented as a rectangle. To simplify the diagram, the function ƒ(m,n) will be represented as a continuous function of two discrete variables m And n.

Rectangular function
The figure below, using the mesh function, visualizes the amplitude values obtained from the Fourier transform rectangular function shown in the previous figure. Amplitude visualization is also called Fourier transform visualization.

Rectangular function image amplitude
The peak of the function is in the center and displays the value F(0,0), which is the sum of all values ƒ(m,n). All other components represent the distribution of energy over vertical and horizontal frequencies.
Another way to visualize the Fourier transform is to display the values as an image.

Logarithmic representation of the Fourier transform of a rectangular function
Let's look at examples of Fourier transforms of functions of various simple forms.

Examples of Fourier transforms of functions of various simple forms
Discrete cosine transform
Discrete cosine transforms represent an image as a sum of sinusoids with different amplitudes and frequencies. dct2 function in Image application Processing Toolbox implements two-dimensional discrete cosine transforms of images. One of the features of the discrete Fourier transform is that some local areas images can be characterized a small amount discrete Fourier transform coefficients. This property is very often used in the development of image compression methods. For example, the discrete cosine transform is the basis of an international standard used in the JPEG lossy image compression algorithm. The name of the format “JPEG” consists of the first letters of the name working group, which participated in the development of this standard (Joint Photographic Experts Group).
Two-dimensional discrete cosine matrix transform A with dimensions is implemented according to the following expression

Values Bpq are called the coefficients of the discrete cosine transformation of the matrix A.
(It should be noted that matrix indices in MATLAB always start at 1, not 0. Therefore, matrix elements that are represented in MATLAB as A(1,1) and B(1,1) will correspond to elements A 00 And B00 from the above formula.)
The inverse discrete cosine transform is implemented according to the expressions

The inverse discrete cosine transform expression can be interpreted as a matrix representation A with dimensions as the sum of the following functions
These functions are called the fundamental (basic) functions of the discrete cosine transform. Discrete Cosine Transform Coefficients Bpq can be considered as weights for each basic function. For example, for a matrix with element size there are 64 basic functions, which is shown in the image.

64 basic functions obtained for a matrix with element sizes
Horizontal frequencies increase from left to right, and vertical frequencies increase from top to bottom.
Discrete Cosine Transform Matrix
Application Image Processing Toolbox offers two different ways implementation of discrete cosine transformations. The first method is implemented in the dct2 function. The dct2 function uses fast Fourier transform to speed up calculations. The second method uses the discrete cosine transform matrix, which is returned by the dctmtx function. The transformation matrix T is formed according to the following expression

For matrix A with dimensions is a matrix with dimensions , where each column contains a one-dimensional discrete cosine transform A. Two-dimensional discrete cosine transform A calculated as B=T*A*T’. Inverse two-dimensional discrete cosine transform B calculated as T'*B*T.
Discrete Cosine Transforms and Image Compression
In the JPEG image compression algorithm, the original image is divided into blocks of dimensions or elements. Next, a two-dimensional discrete cosine transform is calculated for each block. The coefficients of discrete cosine transforms are quantized, encoded and transmitted. The JPEG receiver decodes the discrete cosine transform coefficients, calculates the inverse 2D discrete cosine transform in each block, and then stitches them together into a single image.
Let's consider an example of calculating two-dimensional discrete cosine transforms in blocks with the sizes of the elements of the original image. Further, when reconstructing the image, we will take into account only 10 coefficients from each block, the rest will be set to zero. When carrying out the described calculations, the transformation matrix will also be used.
I = imread("cameraman.tif"); I = im2double(I); T = dctmtx(8); B = blkproc(I,,"P1*x*P2",T,T"); mask = ; B2 = blkproc(B,,"P1.*x",mask); I2 = blkproc(B2,,"P1 *x*P2",T",T); imshow(I); figure, imshow(I2)

The figure shows two images - the original and the reconstructed one. Only 15% of discrete cosine transform coefficients were used in image reconstruction. However, it should be noted that the quality of the reconstructed image is quite acceptable. To view other properties of the discrete cosine transform, see the dctdemo function.
Radon transformations
The radon function in the Image Processing Toolbox calculates a matrix of image projections along specified directions. The projection of a two-dimensional function f(x,y) is equal to the integral along specified line. The Radon function is the calculation of image projections on an axis, which are specified by angles in degrees relative to the horizontal counterclockwise. The figure shows the projection of a certain figure at a specified angle

Parallel beam projection with rotation angle theta
The figure below shows the horizontal and vertical projections for a simple two-dimensional function.

Horizontal and vertical projections of some simple function
Projections can be calculated along arbitrary angle theta. The radon function built into the Image Processing Toolbox calculates image projections along certain directions. The projection of a two-dimensional function f(x,y) onto the x’ axis is a linear integral

Thus, the x’ y’ axes are specified by rotating by an angle counterclockwise.
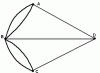
The image below illustrates the geometry of the Radon transform.

Radon Transform Geometry
Visualization of Radon transformations
When performing Radon transformations, it is necessary to specify the original image and the vector of angles theta.
Radon(I,theta);
R is a matrix in which each column is the Radon transform for one of the angles contained in the vector theta. The vector xp contains the corresponding coordinates along the x axis. The central pixel I is determined according to the expression floor((size(I)+1)/2).
Let's look at how projections are calculated in Radon transforms. Let's consider projections at an angle of 0° and 45°.
I = zeros(100,100); I(25:75, 25:75) = 1; imshow(I)

Radon(I,); figure; plot(xp,R(:,1)); title("R_(0^o) (x\prime)")
Radon transformations at 0°
Figure; plot(xp,R(:,2)); title("R_(45^o) (x\prime)")

Radon transformations at 45°
Radon transformations at large number angles are often displayed as an image. IN in this example Radon transformations for an image in the form of a square are considered at an angle range from 0° to 180° with a resolution of 1°.
Theta = 0:180; = radon(I,theta); imagesc(theta,xp,R); title("R_(\theta) (X\prime)"); xlabel("\theta (degrees)"); ylabel("X\prime"); set(gca,"XTick",0:20:180); colormap(hot); colorbar

Radon transformations using 180 projections
Using Radon transforms when detecting lines
Radon transformations are similar to other well-known operations, which are known as Hoch transformations. The radon function can be used to detect straight lines. Let's look at the main stages of this process.

Largest peak in matrix R corresponds to =1° and x´= -80. A line is drawn from the center of the original image at an angle at a distance x’. A straight line is drawn perpendicular to this line, which corresponds to the straight line on original image. In addition, there are other lines in the image that are presented in the matrix R corresponding peaks.

Radon Transform Geometry for Straight Line Detection
This is one of the Fourier transforms widely used in digital signal processing algorithms (its modifications are used in audio compression in MP3, image compression in JPEG, etc.), as well as in other areas related to the analysis of frequencies in discrete (for example, digitized analog ) signal. The discrete Fourier transform requires as input discrete function. Such functions are often created by sampling (sampling values from continuous functions). Discrete Fourier transforms help solve partial differential equations and perform operations such as convolutions. Discrete Fourier transforms are also actively used in statistics, in the analysis of time series. Transformations can be one-dimensional, two-dimensional and even three-dimensional.
Direct conversion:
Reverse conversion:
Designations:
§ N- the number of signal values measured over a period, as well as the number of decomposition components;
§ - measured signal values (at discrete time points with numbers that are input data for direct conversion and weekends for the return;
§ - N complex amplitudes of sinusoidal signals composing the original signal; are output data for direct conversion and input data for reverse conversion; since amplitudes are complex, it is possible to calculate both amplitude and phase from them;
§ is the usual (real) amplitude of the kth sinusoidal signal;
§ arg( Xk) - phase of the kth sinusoidal signal (argument of a complex number);
§ k- frequency of the kth signal, equal to , where T- the period of time during which the input data was taken.
From the latter it is clear that the transformation decomposes the signal into sinusoidal components (which are called harmonics) with frequencies from N oscillations per period to one oscillation per period. Since the sampling frequency itself is equal to N samples per period, high-frequency components cannot be displayed correctly - a moiré effect occurs. This leads to the fact that the second half of the N complex amplitudes is, in fact, a mirror image of the first and does not carry additional information.
Consider some periodic signal x(t) with a period equal to T. Let us expand it into a Fourier series:

Let us sample the signal so that there are N samples per period. Discrete signal Let's present it in the form of readings: x n = x(tn), where , then these readings through the Fourier series will be written as follows:

Using the relation: , we get:
 Where
Where 
So we got inverse discrete Fourier transform.
Let us now scalarly multiply the expression for x n on and we get:
Here we use: a) an expression for the sum of a finite number of terms (exponents) geometric progression, and b) the expression of the Kronecker symbol as the limit of the ratio of Euler functions for complex numbers. It follows that:

This formula describes direct discrete Fourier transform.
In the literature, it is customary to write the multiplier in the inverse transformation, and therefore the transformation formulas are usually written in the following form:
The discrete Fourier transform is a linear transformation that transforms a vector of time samples into a vector of spectral samples of the same length. So the transformation can be implemented as a multiplication square matrix to vector:
I believe that everything is general outline know about the existence of such a wonderful mathematical tool as the Fourier transform. However, for some reason it is taught so poorly in universities that relatively few people understand how this transformation works and how it should be used correctly. Meanwhile, the mathematics of this transformation is surprisingly beautiful, simple and elegant. I invite everyone to learn a little more about the Fourier transform and the related topic of how analog signals can be effectively converted into digital ones for computational processing.
No use complex formulas and Matlab I will try to answer the following questions:
- FT, DTF, DTFT - what are the differences and how do seemingly completely different formulas give such conceptually similar results?
- How to correctly interpret the results fast conversion Fourier (FFT)
- What to do if you are given a signal of 179 samples and the FFT requires an input sequence of length equally deuces
- Why, when trying to obtain the spectrum of a sinusoid using Fourier, instead of the expected single “stick”, a strange squiggle appears on the graph and what can be done about it
- Why are analog filters placed before the ADC and after the DAC?
- Is it possible to digitize an ADC signal with a frequency higher than half the sampling frequency (the school answer is incorrect, the correct answer is possible)
- How to restore the original signal using a digital sequence
I will proceed from the assumption that the reader understands what an integral is, a complex number (as well as its modulus and argument), convolution of functions, plus at least a “hands-on” idea of what the Dirac delta function is. If you don’t know, no problem, read the above links. Under “product of functions” in this text I will understand “pointwise multiplication” everywhere
We should probably start with the fact that normal conversion Fourier is a kind of thing that, as you can guess from the name, transforms some functions into others, that is, associates each function of a real variable x(t) with its spectrum or Fourier image y(w):

If we give analogies, then an example of a transformation similar in meaning can be, for example, differentiation, turning a function into its derivative. That is, the Fourier transform is essentially the same operation as taking the derivative, and it is often denoted in a similar way, drawing a triangular “cap” over the function. Only in contrast to differentiation, which can also be defined for real numbers, the Fourier transform always “works” with more general complex numbers. Because of this, there are always problems with displaying the results of this conversion, since complex numbers are determined not by one, but by two coordinates on the operating real numbers graphics. The most convenient way, as a rule, is to represent complex numbers in the form of a modulus and an argument and draw them separately as two separate graphs:

The graph of the argument of the complex value is often called in this case the “phase spectrum”, and the graph of the modulus is often called the “amplitude spectrum”. The amplitude spectrum is usually of much greater interest, and therefore the “phase” part of the spectrum is often skipped. In this article we will also focus on “amplitude” things, but we should not forget about the existence of the missing phase part of the graph. In addition, instead of the usual complex value module, it is often drawn decimal logarithm multiplied by 10. The result is a logarithmic graph with values displayed in decibels (dB).

Please note that not very much negative numbers logarithmic graph (-20 dB or less) correspond practically zero numbers on the “normal” chart. Therefore, the long and wide “tails” of various spectra on such graphs, when displayed in “ordinary” coordinates, as a rule, practically disappear. The convenience of such a strange at first glance representation arises from the fact that Fourier images various functions often it is necessary to multiply among themselves. With such pointwise multiplication of complex-valued Fourier images, their phase spectra are added, and their amplitude spectra are multiplied. The first is easy to do, while the second is relatively difficult. However, the logarithms of the amplitude add up when multiplying the amplitudes, so logarithmic graphs amplitudes, like phase graphs, can simply be added point by point. In addition, in practical problems It is often more convenient to operate not with the “amplitude” of the signal, but with its “power” (the square of the amplitude). On logarithmic scale both graphs (both amplitude and power) look identical and differ only in the coefficient - all values on the power graph are exactly twice as large as on the amplitude scale. Accordingly, to plot the power distribution by frequency (in decibels), you can not square anything, but calculate the decimal logarithm and multiply it by 20.
Are you bored? Wait a little longer, we'll be done with the boring part of the article explaining how to interpret graphs soon :). But before that, you should understand one extremely important thing: Although all of the above spectrum plots were drawn for some limited ranges of values (positive numbers in particular), all of these plots actually continue to plus and minus infinity. The graphs simply depict some “most meaningful” part of the graph, which is usually mirrored for negative values parameter and is often repeated periodically with a certain step when considered on a larger scale.
Having decided what is drawn on the graphs, let's return to the Fourier transform itself and its properties. There are several different ways how to determine this transformation, differing in small details (different normalizations). For example, in our universities, for some reason, they often use the normalization of the Fourier transform, which defines the spectrum in terms of angular frequency (radians per second). I will use a more convenient Western formulation that defines the spectrum in terms of ordinary frequency (hertz). Direct and inverse conversion Fourier in this case is determined by the formulas on the left, and some properties of this transformation that we will need are determined by a list of seven points on the right:

The first of these properties is linearity. If we take some linear combination of functions, then the Fourier transform of this combination will be the same linear combination of the Fourier images of these functions. This property allows you to reduce complex functions and their Fourier transforms to simpler ones. For example, the Fourier transform of a sinusoidal function with frequency f and amplitude a is a combination of two delta functions located at points f and -f and with coefficient a/2:

If we take a function consisting of the sum of a set of sinusoids with different frequencies, then, according to the property of linearity, the Fourier transform of this function will consist of a corresponding set of delta functions. This allows us to give a naive but visual interpretation of the spectrum according to the principle “if in the spectrum of a function frequency f corresponds to amplitude a, then the original function can be represented as a sum of sinusoids, one of which will be a sinusoid with frequency f and amplitude 2a.” Strictly speaking, this interpretation is incorrect, since the delta function and the point on the graph are completely different things, but as we will see later, for discrete Fourier transforms it will not be so far from the truth.
The second property of the Fourier transform is the independence of the amplitude spectrum from the time shift of the signal. If we move a function left or right along the x-axis, then only its phase spectrum.
The third property is that stretching (compressing) the original function along the time axis (x) proportionally compresses (stretches) its Fourier image along the frequency scale (w). In particular, the spectrum of a signal of finite duration is always infinitely wide and, conversely, the spectrum of finite width always corresponds to a signal of unlimited duration.
The fourth and fifth properties are perhaps the most useful of all. They make it possible to reduce the convolution of functions to a pointwise multiplication of their Fourier images, and vice versa - the pointwise multiplication of functions to the convolution of their Fourier images. A little further I will show how convenient this is.
The sixth property speaks of the symmetry of Fourier images. In particular, from this property it follows that in the Fourier transform of a real-valued function (i.e., any “real” signal), the amplitude spectrum is always even function, and the phase spectrum (if brought to the range -pi...pi) is odd. It is for this reason that spectra are almost never drawn on graphs. negative part spectrum - for real-valued signals it does not provide any new information(but, I repeat, it is not zero either).
Finally, the last, seventh property, says that the Fourier transform preserves the “energy” of the signal. It is meaningful only for signals of finite duration, the energy of which is finite, and suggests that the spectrum of such signals at infinity quickly approaches zero. It is precisely because of this property that spectrum graphs usually depict only the “main” part of the signal, which carries the lion’s share of the energy - the rest of the graph simply tends to zero (but, again, is not zero).
Armed with these 7 properties, let's look at the mathematics of “digitizing” a signal to translate continuous signal into a sequence of numbers. To do this, we need to take a function known as the “Dirac comb”:

A Dirac comb is simply a periodic sequence of delta functions with unity coefficient, starting at zero and proceeding with step T. For digitizing signals, T is chosen as small a number as possible, T<<1. Фурье-образ этой функции - тоже гребенка Дирака, только с гораздо большим шагом 1/T и несколько меньшим коэффициентом (1/T). С математической точки зрения, дискретизация сигнала по времени - это просто поточечное умножение исходного сигнала на гребенку Дирака. Значение 1/T при этом называют частотой дискретизации:

Instead of a continuous function, after such multiplication, a sequence of delta pulses of a certain height is obtained. Moreover, according to property 5 of the Fourier transform, the spectrum of the resulting discrete signal is a convolution of the original spectrum with the corresponding Dirac comb. It is easy to understand that, based on the properties of convolution, the spectrum of the original signal is, as it were, “copied” an infinite number of times along the frequency axis with a step of 1/T, and then summed.

Note that if the original spectrum had a finite width and we used a sufficiently high sampling frequency, then the copies of the original spectrum will not overlap, and therefore will not sum with each other. It is easy to understand that from such a “collapsed” spectrum it will be easy to restore the original one - it will be enough to simply take the spectrum component in the region of zero, “cutting off” the extra copies going to infinity. The simplest way to do this is to multiply the spectrum by a rectangular function equal to T in the range -1/2T...1/2T and zero outside this range. Such a Fourier transform corresponds to the function sinc(Tx) and according to property 4, such a multiplication is equivalent to the convolution of the original sequence of delta functions with the function sinc(Tx)


That is, using the Fourier transform, we have a way to easily reconstruct the original signal from a time-sampled one, working provided that we use a sampling frequency that is at least twice (due to the presence of negative frequencies in the spectrum) higher than the maximum frequency present in the original signal. This result is widely known and is called the “Kotelnikov/Shannon-Nyquist theorem”. However, as it is easy to notice now (understanding the proof), this result, contrary to the widespread misconception, determines sufficient, but not necessary condition for restoring the original signal. All we need is to ensure that the part of the spectrum that interests us after sampling the signal does not overlap each other, and if the signal is sufficiently narrowband (has a small “width” of the non-zero part of the spectrum), then this result can often be achieved at a sampling frequency much lower than twice the maximum frequency of the signal. This technique is called “undersampling” (subsampling, bandpass sampling) and is quite widely used in processing all kinds of radio signals. For example, if we take an FM radio operating in the frequency band from 88 to 108 MHz, then to digitize it we can use an ADC with a frequency of only 43.5 MHz instead of the 216 MHz assumed by Kotelnikov’s theorem. In this case, however, you will need a high-quality ADC and a good filter.
Let me note that “duplication” of high frequencies with frequencies of lower orders (aliasing) is an immediate property of signal sampling that irreversibly “spoils” the result. Therefore, if the signal can, in principle, contain high-order frequencies (that is, almost always), an analog filter is placed in front of the ADC, “cutting off” everything unnecessary directly in the original signal (since after sampling it will be too late to do this). The characteristics of these filters, as analog devices, are not ideal, so some “damage” to the signal still occurs, and in practice it follows that the highest frequencies in the spectrum are, as a rule, unreliable. To reduce this problem, the signal is often oversampled, setting the input analog filter to a lower bandwidth and using only the lower part of the theoretically available frequency range of the ADC.
Another common misconception, by the way, is when the signal at the DAC output is drawn in “steps”. “Steps” correspond to the convolution of a sampled signal sequence with a rectangular function of width T and height 1:

The signal spectrum with this transformation is multiplied by the Fourier image of this rectangular function, and for a similar rectangular function it is again sinc(w), “stretched” the more, the smaller the width of the corresponding rectangle. The spectrum of the sampled signal with such a “DAC” is multiplied point by point by this spectrum. In this case, unnecessary high frequencies with “extra copies” of the spectrum are not completely cut off, but the upper part of the “useful” part of the spectrum, on the contrary, is attenuated.

In practice, of course, no one does this. There are many different approaches to constructing a DAC, but even in the closest in meaning to a weighting-type DAC, the rectangular pulses in the DAC, on the contrary, are chosen to be as short as possible (approximating the real sequence of delta functions) in order to avoid excessive suppression of the useful part of the spectrum. “Extra” frequencies in the resulting broadband signal are almost always canceled out by passing the signal through an analog low-pass filter, so that there are no “digital steps” either “inside” the converter, or, especially, at its output.
However, let's go back to the Fourier transform. The Fourier transform described above applied to a pre-sampled signal sequence is called the Discrete Time Fourier Transform (DTFT). The spectrum obtained by such a transformation is always 1/T-periodic, therefore the DTFT spectrum is completely determined by its values on the segment )