The units for measuring phase shift are radian and degree:
1° = π/180 rad.
In the catalog classification, electronic meters of phase difference and group delay time are designated as follows: F1 - standard devices, F2 - phase meters, FZ - measuring phase shifters, F4 - group delay time meters, F5 - correlation meters.
Electromechanical phase meters on the front panel have the sign ∆φ.
The phase characterizes the state of the harmonic process in at the moment time:
u(t) = Um sin (ωt+ φ).
The phase is the entire argument of the sine function ( ωt+ φ). Typically, ∆φ is measured for oscillations of the same frequency:
u 1(t) =Um sin ( ωt+ φ 1);
u 2(t) =Um sin ( ωt+ φ 2).
In this case, the phase shift
∆φ = ( ωt+ φ 1) - ( ωt- φ 2) = φ 1 - φ 2 (5.10)
For simplicity, we take the initial phase of one oscillation as zero (for example, φ 2 = 0), then ∆φ = φ 1.
The above concept of phase shift applies only to harmonic signals. For non-harmonic (pulse) signals, the concept of time shift (delay time) is applicable t 3), diagrams of which are shown in Fig. 5.6.
Rice. 5.6. Stress diagrams with time shift
Phase shift measurement is widely used in industrial and ultra high frequencies, i.e. over the entire frequency range.
The phase shift occurs, for example, between the input and output voltages of a four-terminal network, as well as in AC power circuits between current and voltage and determines the power factor (cos φ), and therefore the power in the circuit under study.
To measure the phase shift on industrial frequencies Electromechanical phase meters of electrodynamic and ferrodynamic systems are widely used. The disadvantages of such phase meters are the relatively large power consumption from the signal source and the dependence of the readings on frequency. The relative reduced error of electromechanical phase meters is no more than ±0.5%.
Depending on the required accuracy of measuring the phase shift and signal frequency, one of the following is used: following methods: oscillographic (one of three), compensation, electronic discrete counting method, method of converting phase shift into current pulses, measurement method using phase meters based on a microprocessor system, signal frequency conversion method.
Oscillographic methods, in turn, are divided into three: linear scan, sinusoidal scan (ellipse) and circular scan.
For implementation linear sweep method use a two-channel or two-beam oscilloscope (or a single-beam oscilloscope with an electronic switch). The screen produces an image of sinusoidal signals (Fig. 5.7).

Rice. 5.7. Oscillograms of two sinusoidal signals when measuring phase shift using the linear sweep method
Signals u 1(t)And u 2(t) are supplied to the inputs Y1 and Y2 of the oscilloscope. To ensure the motionlessness of the oscillograms, it is necessary to synchronize the sweep with one of the signals being studied.
By measured segments 0 a and 0 b the phase shift is calculated from the relation
![]() (5.11)
(5.11)
The linear sweep method allows you to determine the sign of the phase shift and covers the full range of its measurement - 0...360°. The error of the method is ± (5...7°) and is determined by the nonlinearity of the unfolding voltage, the inaccuracy of measuring the linear dimensions of segments 0 A and 0 b, the quality of focusing and brightness of the beam (i.e., the skill of the operator).
Sine sweep method implemented using one; beam oscilloscope. Tested voltage signals u 1 (t) And u2(t) are supplied to the X and Y inputs of the oscilloscope when the internal linear scan generator is turned off. A figure in the form of an ellipse will appear on the screen (Fig. 5.8), the shape of which depends on the phase shift between the two voltages and their amplitudes. The phase shift is determined by the formula
![]() (5.12)
(5.12)

Rice. 5.8. The resulting oscillogram when measuring the phase shift using the sinusoidal sweep method
To reduce the error, the amplitudes are equalized before measurement X t And Y m their smooth regulation along channels Y and X.
The sinusoidal sweep method allows you to measure the phase shift in the range from 0...180° without determining the sign.
The error in measuring ∆φ by the sinusoidal sweep method (ellipse method) depends on the accuracy of measuring the segments included in equation (5.12), on the quality of focusing and the brightness of the beam on the CRT screen. These reasons have a noticeable effect at a phase shift close to zero and 90°.
Both methods considered are indirect and quite labor-intensive.
Circular scanning method - the most convenient oscillographic method for measuring phase shift. In this case, the sign of the phase shift is determined over the entire angle measurement range (0...360°). The measurement error is constant over the entire range.
Block diagram oscilloscope when measuring the phase shift using the circular scanning method is shown in Fig. 5.9, A.

Rice. 5.9. Block diagram of the implementation of the circular scanning method (a), angle reading (b) and diagrams of sinusoidal signals (V) when measuring phase shift
The X and Y inputs of the oscilloscope are supplied with sinusoidal voltage signals U 1 And U 3, shifted relative to each other by 90° using a phase shifter consisting of a resistor and capacitor. If the arm resistances are equal, the voltage amplitudes U 1 And U 3 are also equal and an oscillogram in the form of a circle will be observed on the screen (Fig. 5.9, b).
Comparable signals u 1 (t) And u2(t) are supplied to the inputs of two identical shapers, which convert sinusoidal voltages into a sequence of short unipolar pulses with voltage U 4 And U 5(Fig. 5.9 , V) with steep fronts. The beginning of the pulses coincides with the moment of transition of the sinusoids across the time axis as they increase. Signals with voltage U 4 And U 5 arrive at the OR logic circuit, where they are summed up, and a sequence of pulses with voltage appears at the output U6, which are fed to the control electrode (modulator) of the tube, controlling the brightness of the beam at points 1 and 2, and points of increased brightness are observed on the circle at points 1 and 2.
The phase shift between signals occurs as follows (see Fig. 5.9, b). When measuring, the center of the transparent protractor is aligned with the center of the circle, the total circumference of which corresponds to 360°. For the period T signals under study with voltage U 1 And U 2 the electron beam describes a circle. The beam describes an arc between points 1 and 2, the length of which is equal to a certain angle α, during the delay time of these signals: ∆ t =∆φ T/ 360°, from where α= ∆φ.
Absolute error measurements using the circular scanning method reaches 2...5° and depends on the accuracy of determining the center of the circle, the accuracy of measuring the phase shift using a protractor and the degree of identity of the response threshold of both shapers.
Compensation method(overlay method) is implemented using an oscilloscope. The method diagram is shown in Fig. 5.10, A.

Rice. 5.10. Scheme for implementing the compensation method ( A) and oscillogram (6) when measuring phase shift
Signals with voltage U 1 And U 2 are supplied to the Y and X inputs of the oscilloscope, and to the Y input - through a graduated phase shifter, and to the X input directly.
Phase shift between test voltages U 1 And U 2 determined by changing the phase of the signal with voltage U 3 phase shifter until a straight inclined line appears on the screen (Fig. 5.10, b), which indicates that the phases of both signals are equal. The determined phase shift ∆φ is counted on the phase shifter scale relative to the primary position, corresponding to a phase rotation of 180°. To reduce the measurement error, it is necessary to correct the phase shifts created by the amplifiers of the vertical and horizontal deflection channels of the oscilloscope beam. This procedure is carried out in the same sequence as when measuring the phase shift using a sinusoidal sweep method (see Fig. 5.8). An electronic voltmeter can be used as a zero indicator.
The measurement error using the compensation method is small (0.2...0.5°) and is determined mainly by the quality of the phase shifter calibration.
The compensation method is also used in the microwave range when measuring the phase shift introduced by any element additionally included in the microwave path (filter, waveguide section). The block diagram of measuring the phase shift using the compensation method is shown in Fig. 5.11.

Rice. 5.11. Block diagram of measuring phase shift in the microwave range using a compensation method
The measurement process is carried out in the following order. When the test element Z is disconnected, the microwave path at the output of the phase shifter is short-circuited with a plug. When the generator is turned on, a standing wave is established in the path. Since the minimum standing wave is more pronounced than the maximum, then by adjusting the phase shifter, the standing wave node is moved relative to the transverse plane of the probe so that the rectifier device (milliammeter) shows the minimum, and the readings of φ 1, the phase shifter, are noted. Then, between the phase shifter and the plug, the test element Z is connected, creating a displacement of the standing wave voltage node, and again, using the phase shifter, the minimum indicator reading is achieved, which will be φ 2 when counted on the phase shifter scale.
The phase shift introduced by the element Z under study into the microwave path is determined by the formula
Instead of a phase shifter and a probe, a measuring line can be used in the circuit under consideration. The described compensation method is indirect.
A two-channel phase meter allows you to measure phase shift directly. The operating principle of a two-channel phase meter is based on converting the phase shift into rectangular pulses. The block diagram of a two-channel phase meter, timing diagrams of signals explaining its operation, and a graph of the readings of the relative ∆φ indicator are presented in Fig. 5.12.

Rice. 5.12. Block diagram of a two-channel phase meter ( A), signal timing diagrams explaining its operation (6) and a graph of indicator readings relative to ∆φ ( V)
The phase meter consists of a converter ∆φ into a time shift ∆ t, equal to the desired phase shift ∆φ and the measuring indicator. The converter consists of two identical signal conditioners and an adder, which is used as a trigger.
Tested voltage signals U 1 And U 2 with a phase shift ∆φ are fed to the inputs of two identical shapers, which convert the incoming sinusoidal signals into a sequence of short pulses with voltage U 3 And U4. Pulses with voltage U 3 trigger the trigger, and the voltage pulses U 4 set it to its original position. As a result, a periodic sequence of pulses is formed at the output, the repetition period and duration of which are equal to the repetition period T and time shift ∆ t studied signals with amplitude I m.
The microammeter of the magnetoelectric system is most often used as a measuring indicator, the readings of which are proportional to the average current value over the signal repetition period T.
As can be seen from the timing diagram I = f (t) ( see fig. 5.12, b), in the circuit of the measuring device, rectangular pulses with a duration of ∆ are obtained t. Therefore, the average value of the current flowing through the devices over the period is proportional to twice the relative time interval:
From the graph (see Fig. 5.12, b) it follows that the phase shift between the studied signals with voltage U 1 And U 2 corresponds to the time shift ∆ t and can be expressed by the formula
![]()
from which it follows that the phase angle depends linearly on the ratio ∆ t/t:
Substituting equation (5.15) into expression (5.14), we obtain
![]() (5.16)
(5.16)
At constant value amplitude of output pulses scale of an indicator measuring the average value of current I 0 , graduated in ∆φ values. In this case, the phase meter indicator scale will be linear. The advantage of a two-channel phase meter is direct measurement∆φ in the range of ±180°.
Electronic method discrete account is the basis for the operation of a digital phase meter and consists of two main stages: converting the phase shift into the corresponding time interval and measuring this time interval using the discrete counting method.
A simplified block diagram of a digital phase meter and timing diagrams explaining its operation are presented in Fig. 5.13.


Rice. 5.13. Block diagram of a phase meter when measuring the phase shift using the discrete counting method (a), and timing diagrams of signals explaining its operation (b)
The sinusoidal signal generated by the quartz oscillator is fed to the formation block, at the output of which counting pulses are generated, arriving at one input of the time selector. Its other input receives a converted sequence of pulses of duration ∆ t with repetition period of the studied signals T. The selector opens only for a time equal to the duration ∆ t pulses with voltage U 3 and passes voltage pulses to the counter U 4 from the generator. The time selector generates pulse packets with voltage U 5 ( without changing the period T), arriving at the counter in one package.
Where T 0 - repetition period of counting pulses of a quartz oscillator.
Substituting the relation for ∆ into formula (5.17) t from formula (5.16), we determine ∆φ for signals with voltage U 1 And U 2
![]() (5.18)
(5.18)
The overall measurement error by this method depends on the discreteness error, which is due to the fact that the interval ∆ t measured accurate to one period T 0, and from the instability of the response time of the converter.
Great opportunities have phase meters with a built-in microprocessor, which can measure the phase shift between two periodic signals for any selected period.
Figure 5.14 shows a block diagram of a phase meter with a built-in microprocessor and timing diagrams of signals explaining its operation.
After the input device, sinusoidal signals with voltage U 1 And U 2 arrive at the inputs of a pulse converter, in which they are converted into short pulses with voltage U" 1 and U" 2 Using the first pair of these pulses, driver 1 generates a pulse with voltage U 3 duration ∆ t, which is equal to the time shift of signals with voltage U 1 And U2. This pulse opens time selector 1, and during its operation, counting pulses with a repetition period pass to the input of counter 1 T 0, which are generated by the microprocessor. 1 packet of voltage pulses passed to the counter input U 4 shown in Fig. 5.14, b. The number of pulses in a packet is expressed by the formula
At the same time, driver 2 generates pulses with voltage U5, with duration, equal to the period repetition of the studied signals with voltage U 1 And U2. This pulse opens selector 2 (for the duration of its action) and passes a packet of voltage pulses from the microprocessor to counter 2 U 6 and with period T0, the number of which in the package is


Rice. 5.14. Block diagram of a phase meter with a built-in microprocessor ( A) and signal timing diagrams explaining its operation (b)
To determine the desired value of the phase shift ∆φ for the selected signal repetition period T it is necessary to find the ratio of quantities (5.19) and (5.20), equal to
then taking into account basic formula∆φ = 360° ∆ t/T multiply this ratio by 360°:
![]() (5.21)
(5.21)
This calculation performed by a microprocessor, to which the number codes generated by counters 1 and 2 are transmitted n And N. With the appropriate microprocessor program, the display shows the value of the phase shift ∆φ for any selected period T. By comparing such shifts in different periods it becomes possible to observe fluctuations of ∆φ and estimate their static parameters, which include mathematical expectation, dispersion, standard deviation, measured average phase shift.
When measuring with a phase meter with a built-in microprocessor the average value of the phase shift ∆φ for specified quantity TO periods T counters 1 and 2 accumulate codes for the number of pulses received at their inputs during TO periods, i.e. number codes PC And N.K. respectively, transmitted to the microprocessor.
A small error in measuring ∆φ with this phase meter can only be obtained at a sufficiently low frequency of the signals being studied. Preliminary (heterodyne) signal conversion allows you to expand the frequency range.
The main metrological characteristics of phase meters that you need to know when choosing a device include the following:
· purpose of the device;
· phase shift measurement range;
· frequency range;
· permissible measurement error.
Ohm's law for AC
If the circuit contains not only active, but also reactive components (capacitance, inductance), and the current is sinusoidal with a cyclic frequency ω, then Ohm’s law is generalized; the quantities included in it become complex:
U = I Z
U = U 0 e iωt- voltage or potential difference,
I- current strength,
Z = Re -iδ- complex resistance (impedance),
R = (R a 2 +R r 2 ) 1/2 - total resistance,
R r = ωL - 1/ωC- reactance(difference between inductive and capacitive),
R A- active (ohmic) resistance, independent of frequency,
δ = -arctg R r /R a- phase shift between voltage and current.
In this case, the transition from complex variables in the values of current and voltage to real (measured) values can be made by taking the real or imaginary part (but in all elements of the circuit the same!) of the complex values of these quantities. Accordingly, the reverse transition is constructed for, for example, U = U 0 sin(ωt + φ) such a selection U = U 0 e iωt, What InU = U. Then all values of currents and voltages in the circuit must be considered as F = ImF.
If the current varies with time, but is not sinusoidal (or even periodic), then it can be represented as the sum of sinusoidal Fourier components. For linear circuits, the components of the Fourier expansion of the current can be considered to act independently.
It should also be noted that Ohm’s law is only the simplest approximation for describing the dependence of the current on the potential difference and for some structures it is valid only in a narrow range of values. To describe more complex (nonlinear) systems, when the dependence of resistance on current cannot be neglected, it is customary to discuss the current-voltage characteristic. Deviations from Ohm's law are also observed in cases where the rate of change of the electric field is so high that the inertia of charge carriers cannot be neglected.
2. What is the phase shift between voltage and current in a circuit containing a coil or capacitance?
Phase shift- difference between initial phases two variable quantities that change periodically over time with the same frequency. The phase shift is a dimensionless quantity and can be measured in degrees, radians or fractions of a period. In electrical engineering, the phase shift between voltage and current determines the power factor in AC circuits.
In radio engineering, RC circuits are widely used, which shift the phase by approximately 60°. To shift the phase by 180°, you need to connect three RC chains in series. Used in RC generators.
The EMF induced in the secondary windings of a transformer for any current shape coincides in phase and shape with the EMF in the primary winding. When the windings are turned on in antiphase, the transformer changes the polarity of the instantaneous voltage to the opposite; in the case of sinusoidal voltage, it shifts the phase by 180°. Used in the Meissner generator, etc.
 Fig. 305
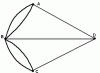
Rice. 305. Experience in detecting phase shifts between current and voltage: on the left - experimental diagram, on the right - results gives the shape of the voltage between the plates of the capacitor (points a and b), because in this loop of the oscilloscope the current at each instant of time is proportional to the voltage. Experience shows that in this case the current and voltage curves are shifted in phase, with the current leading the voltage in phase by a quarter of a period (p/2). If we replaced the capacitor with a coil with high inductance (Fig. 305, b), it would turn out that the current is out of phase with the voltage by a quarter of a period (by p/2). Finally, in the same way it could be shown that in the case of active resistance, voltage and current are in phase (Fig. 305, c). In the general case, when a section of a circuit contains not only active, but also reactive (capacitive, inductive, or both) resistance, the voltage between the ends of this section is phase shifted relative to the current, and the phase shift ranges from +p/2 to -p/2 and is determined by the ratio between the active and reactance of a given section of the circuit. What is the physical reason for the observed phase shift between current and voltage? If the circuit does not include capacitors and coils, i.e., the capacitive and inductive resistance of the circuit can be neglected in comparison with the active one, then the current follows the voltage, passing simultaneously with it through maxima and zero values, as shown in Fig. 305, v. If the circuit has noticeable inductance L, then when alternating current passes through it, a EMF. self-induction. This EMF, according to Lenz's rule, is directed in such a way that it tends to interfere with those changes in the magnetic field (and, consequently, changes in the current that creates this field) that cause emf. d.s. induction. As the current increases, e. d.s. self-induction prevents this increase, and therefore the current reaches its maximum later than in the absence of self-induction. As the current decreases, e. d.s. self-induction tends to maintain the current and zero current values will be reached in more late moment than in the absence of self-induction. Thus, in the presence of inductance, the current lags in phase with the outflow in the absence of inductance, and therefore lags in phase with its voltage. If the active resistance of the circuit R can be neglected compared to its inductive reactance XL=wL, then the time lag of the current and voltage ![]() equals T/4(phase shift is p/2), i.e. maximum u coincides with i=0, as shown in Fig. 305, b. Indeed, in this case the voltage across the active resistance Ri=0, because R=0, and therefore all external stress u is balanced induced emf, which is opposite to it in the direction: u=LDi/Dt. Thus, the maximum u coincides with the maximum Di/Dt, i.e. occurs at the moment when i changes most quickly, and this happens when i=0. On the contrary, at the moment when i passes through the maximum value, the current change is the smallest ( Di/Dt=0), i.e. at this moment u=0. If the active resistance of the circuit R is not so small that it can be neglected, then part of the external voltage drops across the resistance R, and the rest is balanced by e. d.s. self-induction: u=Ri+LDi/Dt. In this case the maximum i distance from the maximum and in time less than T/4(phase shift less p/2) as shown
equals T/4(phase shift is p/2), i.e. maximum u coincides with i=0, as shown in Fig. 305, b. Indeed, in this case the voltage across the active resistance Ri=0, because R=0, and therefore all external stress u is balanced induced emf, which is opposite to it in the direction: u=LDi/Dt. Thus, the maximum u coincides with the maximum Di/Dt, i.e. occurs at the moment when i changes most quickly, and this happens when i=0. On the contrary, at the moment when i passes through the maximum value, the current change is the smallest ( Di/Dt=0), i.e. at this moment u=0. If the active resistance of the circuit R is not so small that it can be neglected, then part of the external voltage drops across the resistance R, and the rest is balanced by e. d.s. self-induction: u=Ri+LDi/Dt. In this case the maximum i distance from the maximum and in time less than T/4(phase shift less p/2) as shown 
Initial phases of electromagnetic sinusoidal oscillations of primary and secondary voltage, with frequency same size, can differ significantly by a certain phase shift angle (angle φ). Variable quantities can change repeatedly over a certain period of time with a certain frequency. If electrical processes have an unchanged character, and the phase shift equal to zero, this indicates the synchronism of sources of alternating voltage values, for example, transformers. The phase shift is the determining factor for the power factor in electrical networks AC.
The phase shift angle is found if necessary, then if one of the signals is a reference signal, and the second signal with a phase at the very beginning coincides with the phase shift angle.
The phase shift angle is measured using a device that has a normalized error.
The phase meter can measure the shift angle within the range from 0 o to 360 o, in some cases from -180 o C to +180 o C, and the range of measured signal frequencies can range from 20 Hz to 20 GHz. The measurement is guaranteed if the input signal voltage is between 1 mV and 100 V, but if the input signal voltage exceeds these limits, the measurement accuracy is not guaranteed.
Methods for measuring phase angle
There are several ways to measure the phase angle, these are:
- Using a dual-beam or dual-channel oscilloscope.
- The compensation method is based on comparing the measured phase shift with the phase shift provided by a reference phase shifter.
- The sum-difference method consists of using harmonic or shaped square-wave signals.
- Conversion of phase shift in the time domain.
How to measure phase angle with an oscilloscope
The oscillographic method can be considered the simplest with an error of around 5 o. The shift is determined using oscillograms. There are four oscillographic methods:
- Application of linear sweep.
- Ellipse method.
- Circular scanning method.
- Using brightness marks.
Determination of the phase shift angle depends on the nature of the load. When determining the phase shift in the primary and secondary circuits of a transformer, the angles can be considered equal and practically do not differ from each other.
Voltage phase angle measured by reference source frequency and when using a measuring body makes it possible to ensure the accuracy of all subsequent measurements. Phase voltages and phase shift angle depend on the load, so a symmetrical load determines the equality of phase voltage, load currents and phase shift angle, and the load in terms of power consumption in all phases of the electrical installation will also be equal.
The phase angle between current and voltage in asymmetrical three-phase circuits is not equal to each other. In order to calculate the phase shift angle (angle φ), series-connected resistances (resistors), inductances and capacitors (capacitors) are included in the circuit.


From the results of the experiment, it can be determined that the phase shift between voltage and current serves to determine the load and cannot depend on the variable current and voltage in the electrical network.
As a conclusion, we can say that:
- The constituent elements of complex resistance, such as resistor and capacitance, as well as conductivity, will not be reciprocal quantities.
- The absence of one of the elements makes the resistive and reactive values, which are part of the complex resistance and conductivity, and makes them reciprocal quantities.
- Reactive quantities in complex resistance and conductivity are used with the opposite sign.
The phase angle between voltage and current is always expressed as the main reasoned factor in the complex resistance φ.
The phase shift is a dimensionless quantity and can be measured in radians (degrees) or fractions of a period. With a constant, in particular zero phase shift, they say about synchronicity two processes, or about the completed synchronization of two sources of variable quantities.
Phase (phase angle) is the angle Where - period, - the fraction of the phase shift period when sinusoids are superimposed on each other. So if the curves ( variables- sinusoids: oscillations, currents) are shifted relative to each other by a quarter of a period, then we say that they are shifted in phase by if for an eighth part (share) of a period, then it means for etc.
When talking about several sinusoids out of phase, technicians talk about current or voltage vectors. The length of the vector corresponds to the amplitude of the sinusoid, and the angle between the vectors corresponds to the phase shift. Many technical devices give us not a simple sinusoidal current, but one whose curve is the sum of several sinusoids (respectively, shifted in phase).
The EMF induced in the secondary windings of a transformer for any current shape coincides in phase and shape with the EMF in the primary winding. When the windings are turned on in antiphase, the transformer changes the polarity of the instantaneous voltage to the opposite; in the case of sinusoidal voltage, it shifts the phase by 180°. Used in the Meissner generator, etc.
Write a review about the article "Phase Shift"
Notes
See also
An excerpt characterizing the Phase Shift
Throughout dinner, Anna Mikhailovna talked about rumors of war, about Nikolushka; I asked twice when it was received last letter from him, although she knew this before, and noticed that it would be very easy, perhaps, to get a letter now. Every time at these hints the countess began to worry and look anxiously, first at the count, then at Anna Mikhailovna, Anna Mikhailovna most imperceptibly reduced the conversation to insignificant subjects. Natasha, of the whole family, most gifted with the ability to sense shades of intonation, glances and facial expressions, from the beginning of dinner her ears pricked up and knew that there was something between her father and Anna Mikhailovna and something concerning her brother, and that Anna Mikhailovna was preparing. Despite all her courage (Natasha knew how sensitive her mother was to everything related to the news about Nikolushka), she did not dare to ask questions at dinner and, out of anxiety, ate nothing at dinner and spun around in her chair, not listening to her governess’s comments. After lunch, she rushed headlong to catch up with Anna Mikhailovna and in the sofa room, with a running start, threw herself on her neck.- Auntie, my dear, tell me, what is it?
- Nothing, my friend.
- No, darling, darling, honey, peach, I won’t leave you behind, I know you know.
Anna Mikhailovna shook her head.
“Voua etes une fine mouche, mon enfant, [You are a delight, my child.],” she said.
- Is there a letter from Nikolenka? Maybe! – Natasha screamed, reading the affirmative answer in Anna Mikhailovna’s face.
- But for God's sake, be careful: you know how this can affect your maman.
- I will, I will, but tell me. Won't you tell me? Well, I’ll go and tell you now.
Anna Mikhailovna in in short words told Natasha the contents of the letter with the condition not to tell anyone.
“Honest, noble word,” Natasha said, crossing herself, “I won’t tell anyone,” and immediately ran to Sonya.
“Nikolenka... wounded... letter...” she said solemnly and joyfully.
- Nicolas! – Sonya just said, instantly turning pale.
Natasha, seeing the impression made on Sonya by the news of her brother’s wound, felt for the first time the whole sad side of this news.
She rushed to Sonya, hugged her and cried. – A little wounded, but promoted to officer; “He’s healthy now, he writes himself,” she said through tears.
“It’s clear that all of you women are crybabies,” said Petya, walking around the room with decisive big steps. “I am so very glad and, truly, very glad that my brother distinguished himself so much.” You are all nurses! you don't understand anything. – Natasha smiled through her tears.
From the series "Physical Basics sound" dedicated to explaining the basics physical processes that musicians and simply music lovers have to deal with. The material is presented in a language accessible to people far from technology, and today we will look at the signal phase and phase shift.
We have come close to explaining what a phase is.
Let's look at the formula that describes a sinusoidal oscillation:
S(t)=Amp*sin(Ф),
Where S(t) is the signal value (sound pressure level, sample size,
voltage level at the speaker input) at time t;
Amp- signal amplitude (maximum possible meaning for this vibration);
sin- sinusoidal function.
F- signal phase is equal to:
Ф=2*PI*f+ф/360*2*PI
P.I.- number “pi”;
f- frequency (pitch) of the signal in Hertz;
f- signal phase shift in degrees.
Phase during the period of fluctuation changes from 0 to 360 degrees. Then again - from 0 to 360, and so on. Since the phase is uniquely related to the level of oscillation at the point of the period corresponding to the phase, then:
Phase, with some assumption, can be considered as the instantaneous signal level at a certain point in time within a period.

When the phase value is 0 degrees, the signal level (sinusoid) is 0.
With a phase value of 90 degrees - 1 Pa.
With a phase value of 180 degrees - again 1 Pa.
With a phase value of 360 degrees (the same as 0 degrees of the next period) - again 0 Pa.
Over time, the signal level changes according to a certain law, so roughly we can say this:
SIGNAL PHASE is the signal level in current moment time.
SIGNAL PHASE- this is the sound pressure level at the current moment in time at our point in space.
Now let’s talk about how such a virtual concept as SIGNAL PHASE affects real life.
Let's say two speakers generate variable sound pressures at the listener's location, which add up to each other. These pressures either increase or decrease. And if we assume that the pressures from both columns change equally, but always in the opposite side. That is,
pressure from the first column is 0.5 Pa (pascals), and from the second minus 0.5 Pa,
from the first minus 1 Pa, from the second 1 Pa.
This phenomenon is called antiphase. The total sound volume at the listener's point is always zero.
What is antiphase according to the sinusoidal oscillation formula?
S(t)=Amp*sin(2*PI*f+f/360*2*PI)
This is when the signal in one column changes according to the formula
S(t)=Amp*sin(2*PI*f+0), phase shift f=0 degrees.
And in the other column the signal changes according to the formula (the signals are the same in shape, but with a time delay)
S(t)=Amp*sin(2*PI*f+180/360*2*PI), phase shift f=180 degrees.
360 degrees is the length of the signal period, 180 degrees is half the signal period.
In other words the oscillation in the second column is delayed by half the period(180 degrees).
If delay is zero, then the signal level, on the contrary, increases, because pressure from the first column is 1 Pa, from the second 1 Pa, in total 1+1=2 Pa. In this case they say that signals in phase(phase shift is 0 degrees).
At phase shift values from 0 to 180 degrees- total volume level becomes less, not yet will become equal to zero at value phase shift 180 degrees.
If phase shift becomes more than 180 degrees, then the total the volume level increases again.
TO BE CONTINUED...